-
Open a native client on the 3DEXPERIENCE platform.
The technique that you use to open a native client depends on your
installation and environment. For example, you can open a client from a desktop
shortcut or from an email invitation to a 3DDashboard. For more information, see the Getting Started
guide.
-
From the Compass, click Material Calibration.
The app opens and displays the Calibration Setup panel. This
panel provides access to most of the actions you need to complete a calibration:
loading the test data, selecting a material model, plotting test data and
material response, and adjusting parameters before running a
calibration.
-
From the top of the Calibration Setup panel, click
Test Data
 . .
-
From the file selection dialog box that appears, navigate to the test data for
butyl rubber (EXAMPLE-ButylRubber-Sample.xlsx), and click
OK.
The Material Test Data Import dialog box appears
with your data displayed in a table.
-
Highlight the first three columns of data, and name the material test data
strain rate = 0.01.
-
From the Domain options, select
Time.
-
From the Deformation mode options, select
Uniaxial.
-
Click Next.
The Material Test Data Import dialog box displays the
imported data in an X-Y plot and in tabular format.
-
Relabel the columns as follows:
| Option | Description |
|---|
| Column 1 |
Time (s) |
| Column 2 |
Nominal Uniaxial Strain (None) |
| Column 3 |
Nominal Uniaxial Stress (MPa) |
-
From the X-Axis options, select Nominal
Uniaxial Strain; and from the Y-Axis
options, select Nominal Uniaxial Stress (MPa).
-
Click Next.
If applicable, you can include additional information about the data collected. This data
can include the environmental temperature, angle of orientation of the material
specimen during testing, or any additional notes.
-
Accept the default values for temperature and the other available settings, and
click Import.
-
Import the remaining four test data sets in the same manner.
-
Close the data import panel.
-
Click Finish.
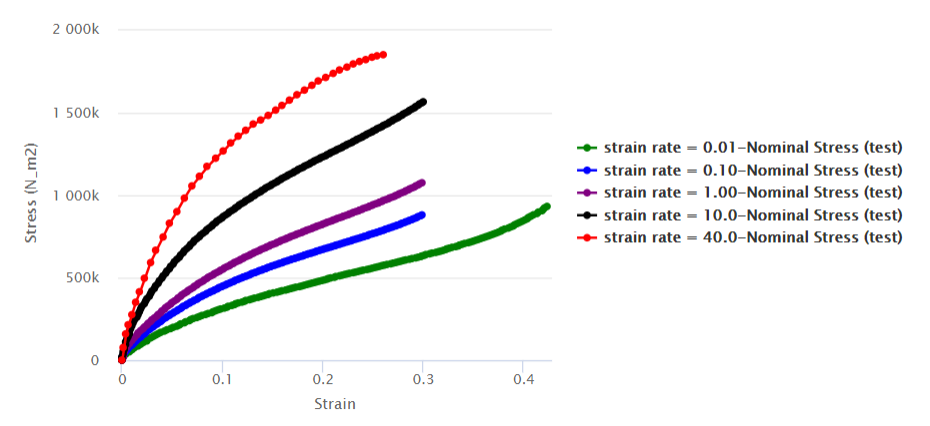
The app opens the Plot panel and plots the test data
points in red.
The image below illustrates the five test data sets with unique colors and
line styles.
The individual test data sets and the plot showing their data are both
available from dedicated sections of the Calibration
Setup panel.
-
Select , and save your work.
|
 > Save > Save All, and save your work.