Analyzing the Distance Between Elements | |||
| |||
-
In the Elements area, select the elements for the
Source and the Target. The
source elements are discretized and projected on the target elements.
Notes:
- All the elements selected before running the command are considered in the Source box.
- Define the elements with the lowest dimension in the Source elements box. For example, you need to select a curve as source element against a surface as target element.
- You can select a surface edge or surface cell as an input to perform the distance analysis.
The distance analysis is displayed between these two sets of elements.
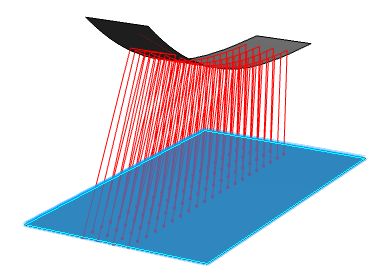
-
Click Inverts the analysis computation
 to
invert the source and target elements.
The analysis is inverted.
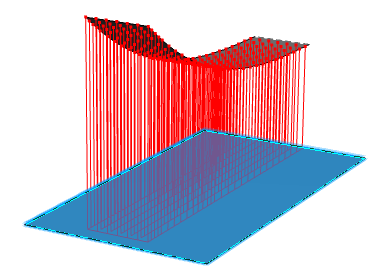
- Adjust the analysis color scale:
- Click Full Color Range
 in the Display Options area.Note: You can also click Limited color range
 . These instructions apply equally to both
color ranges.
 - In the Distance dialog box, click Use Min Max.
- The maximum and minimum values in the dialog box are specified according to the distances between the elements you have selected.
- The analysis colors are updated to match the color scale in the dialog box.
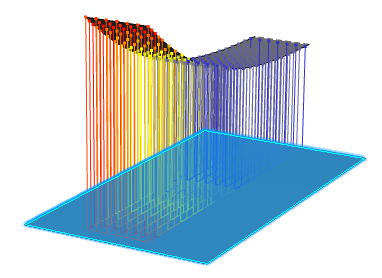
- Click Full Color Range
-
Move the pointer over a source element to analyze the distance at any
point.
The distance analysis at the pointer location is displayed.

-
To analyze the distance between a curve and a surface:
- Create a curve on a plane and a surface as shown below.
- Select the curve as the source and the shape as the target element.
-
Click No Projection of Elements
 in the
Projection Space area.
-
Click Normal Distance
 in the Measurement Direction area.
The analysis is displayed between the curve and the surface in a direction normal to the surface.
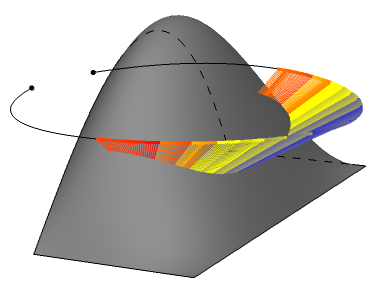
-
Adjust the curve:
-
Click Relimits the discretized curve in the
Relimitation area.
A handle appears on each end of the curve.
-
Drag the handles to adjust the length of the curve.
The analysis is adjusted accordingly.
 Note: When the curve is in the target set, you can use Relimits the non discretized curve.
-
Click Relimits the discretized curve in the
Relimitation area.
-
Click Planar distance
 in the
Projection Space area.
The analysis is displayed between the curve, and the intersection of surface and plane of the curve (available for planar curve only).
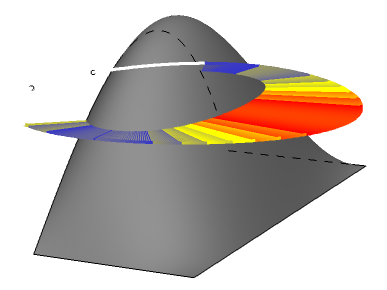
-
To analyze the distance between two surfaces using texture mapping:
- Create two nonplanar surfaces.
- Select the lower surface as the source and the upper surface as the target element.
- Click Texture mapping mode in the Display Options area.
-
Click Full Color Range
 in the Display Options
area.
- In the Distance dialog box, click Use Min Max.
The analysis mapping is displayed on the lower surface.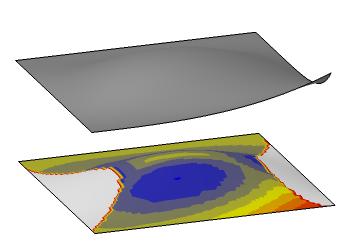
- Click OK to create the analysis.