Display Historic and Real-Time Data
The CloudView
Monitoring Console is based on JRDS (http://jrds.fr/). It
provides detailed system-wide performance analysis, both historic and real-time for:
- EXALEAD services (search and indexing statistics, data structure size, etc.)
- System statistics (CPU load, disk and network activity, memory usage, etc.)
- EXALEAD process health (CPU usage, memory usage, IO activity, etc.)
The Monitoring Console is available at:
http://<HOSTNAME>:<BASEPORT+1>/perf-ui.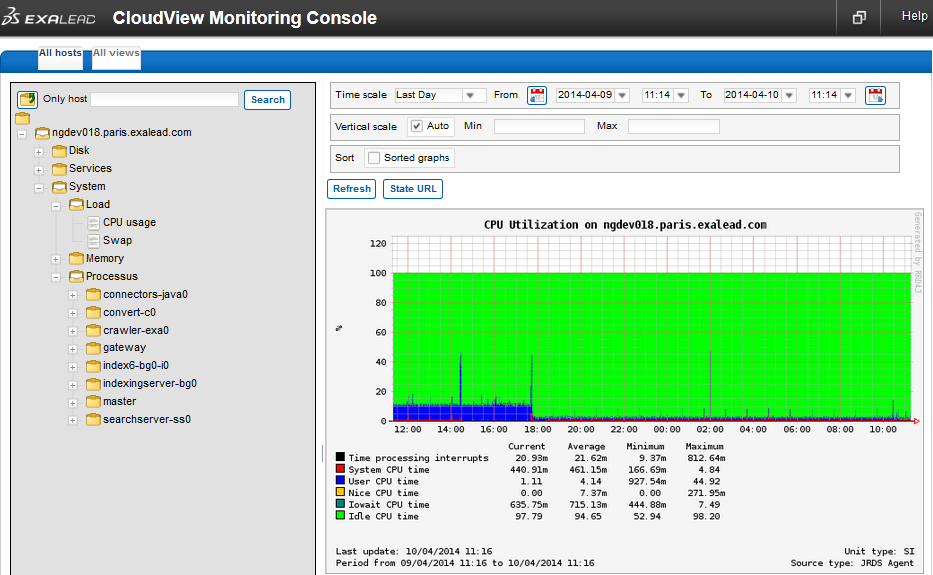
- Select the:
- All hosts tab to display performances by host.
- All views tab to display performances by service.
- For each host, the tree list displays the following node:
- Disk: disk I/O usage
- Services:
- EXALEAD: performance of internal services
- JVM: performance of CloudView processes
- System: performance of the host machine
- To filter the graph views by date, specify a Time scale.
- To filter the values of the graph ordinate (vertical axis), clear Auto and specify the min and max values to display.