Displaying the Geolocated Position | |||
| |||
-
To visualize the sketch grid with geolocated coordinates on labels, click
Display Geolocated Position
 from the View section of the action bar.
The command button appears highlighted in blue. It is grayed out if no geolocation has been activated on the product.
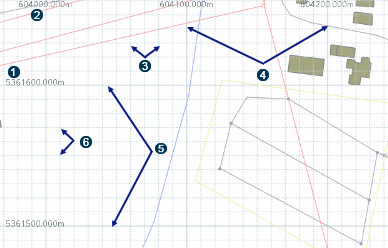
The horizontal and vertical grid labels no longer display the sketch parameters but the geolocated coordinates. And the cursor indicates the geolocated coordinates of the point.

Let us look closely at the grid labels and lines:
 :
Number of the horizontal graduation (Nothing values) at the left and right of the 3D area, and
positioned on the major gridlines
:
Number of the horizontal graduation (Nothing values) at the left and right of the 3D area, and
positioned on the major gridlines :
Number of the vertical graduation (Easting values) at the top and bottom of the 3D area, and
positioned on the major Grid lines
:
Number of the vertical graduation (Easting values) at the top and bottom of the 3D area, and
positioned on the major Grid lines :
Minor vertical gridlines
:
Minor vertical gridlines :
Major vertical gridlines
:
Major vertical gridlines :
Major horizontal gridlines
:
Major horizontal gridlines :
Minor horizontal gridlines
:
Minor horizontal gridlinesThis grid is used for snapping the position of points. Its size changes when you zoom in/out in a sketch. The adaptability of the grid depends on Sketcher preferences, in which you can define for a given range (Normal, Large, Extra Large, Small) the grid characteristics.
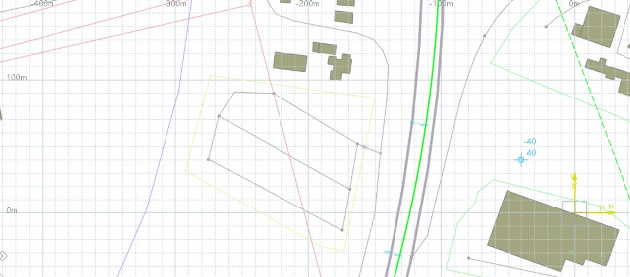
The grid size is a multiple of the graduation. For a graduation number equal to 1, the grid size does not change. According to the zoom level, the value of the grid is multiplied or divided by the graduation number (10, 100, 1000).
The parameters of the grid labels, SmartPick, and Tools Palette describe the terrain's position in a given Coordinate Reference System (CRS), where the Easting and Northing length value defines the projected coordinates. The projected coordinates are expressed in the unit of the CRS, and reflect a given geodetic latitude and longitude.
The local cartesian H/V mode depends on:
- The unit symbol defined for a magnitude length in the Units preferences
- The value of the decimal that is limited up to two digits for a magnitude length defined in millimeter
The geolocation mode depends on:
- No setting, since it is never displayed with exponential notation
- The value of decimal places for read/write numbers defined in the Units preferences
-
To deactivate the command, click Display Geolocated Position
again.
Grid labels display the sketch parameters. And the cursor indicates the H and V coordinates of the point.
The on/off status of the command is saved in the Sketcher preferences. When you reopen the horizontal alignment, you retrieve the previous mode.
-
To activate the display of geolocated coordinates in the SmartPick, click
Display Geolocated Position
.
You can visualize the geolocated coordinates near the cursor. It is locked on along a direction when entering a value in the H or Easting field, or in the V or Northing field of the tools palette. Its display depends on the status of the Visualization of the cursor coordinates option in the Sketcher preferences.
When the Dimensional constraints option is active, at the end of the creation, the entered value for the H/V or Easting/Northing values are converted in a distance constraint between the created point and the absolute axis of the sketch.
Note:You can define an azimuth to work on your design locally and change the horizontal angle of the H plane.
When the azimuth is defined, the grid is no longer geolocated, it is parameterized with the sketch parameters. The cursor still indicates geolocated parameters. True north-based azimuth is an angle in the horizontal plane between the Y direction of an object and the geographic north. The azimuth is a projection plane at a specific distance from the North, and the angle from the North is measured. For example, if the azimuth is 30°, the sketch parameter deviates 30° from the North and the grid is not displayed to avoid discrepancy between the sketcher parameters and the geolocated coordinates.

-
To display geolocated coordinates in the Tools Palette, activate Display
Geolocated Position.
The geolocated coordinates are displayed only during the creation phase and updated at every move of the cursor.
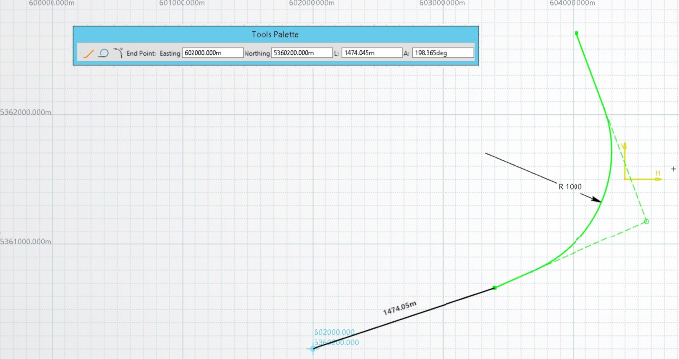
You can also edit the geolocated coordinates in the Tools Palette when using any creation command of sketch.
-
Switch off the command.
The visualization comes back to cartesian parameters. The coordinates of the Tools Palette are defined according to the sketch parameters and the cursor indicates the H and V coordinates.

-
Switch on the command and type geolocated coordinates in the Tools Palette.
You can define the Y parameters and the Easting coordinate (geolocated) is kept because the X parameter is already defined.
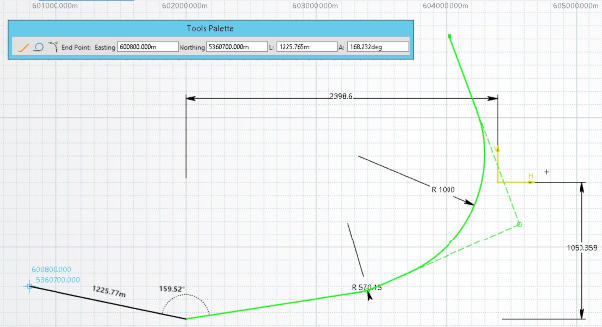
When you design the alignment sketch, constraints are created based on the sketch parameters.
-
To edit the coordinates of a point, line, curve, ellipse, parabola, and hyperbola, do
either of the following:
- Click Display Geolocated Position
to deactivate
geolocation and double-click the geometrical element: the local cartesian coordinates H
and V are displayed in the edition panel
- Click Display Geolocated Position
to activate
geolocation and double-click the geometrical element: the geolocated cartesian
coordinates Easting and Northing are displayed in the edition panel
You can edit the local or geolocated cartesian coordinates in the edition panel. The copy and paste contextual commands are available on the Easting and Northing titles in the Geolocation or edition dialog boxes. - Click Display Geolocated Position