-
Search for an item, including KPI values, in the
3DSearch
text box.
-
Right-click it from the search result and select
Explore.
-
From the
Compass,
select
Information Intelligence
Apps
and click
Product Performance Assessment.
-
From the
Business Insight section of the
action bar,
click
Weight and Balance
 . .
-
Select the root item under the
Navigation experience node.
-
Click the
Secondary Analytics.
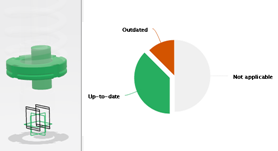
The pie chart displays the analytics associated to the KPI:
Life Cycle,
Missing,
Outdated,Threshold and
Budget and threshold.
-
Click the pie chart to select a category, for example
Missing.
A context toolbar appears with four commands:
3D selection
 ,
3D reveal this category
 ,
3D reveal
 , and
Cancel selection and reveal
 .
-
To highlight the items belonging to the selected category of the
pie chart, click
3D selection
 . .
-
Select a category in the pie chart and click
3D reveal this category
 . .
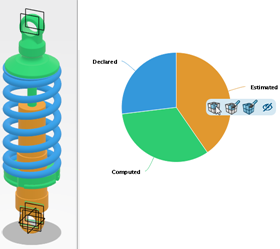
The items corresponding to this category are colored in the
3D area.
The others become transparent.

-
Select a category in the pie chart and click
3D reveal
 . .
The selected item is no more highlighted, and all the items
are colored according to the category they belong to. If some KPI analytics
come from data that are not explored in the session, they cannot be seen in the
work area.

-
To come back to current selected objects and coloring, click
Cancel selection and reveal
 . .
|
 .
.
 ,
3D reveal this category
 ,
3D reveal
 , and
Cancel selection and reveal
 .
.
 .
.
 .
The items corresponding to this category are colored in the 3D area. The others become transparent.
 .
The selected item is no more highlighted, and all the items are colored according to the category they belong to. If some KPI analytics come from data that are not explored in the session, they cannot be seen in the work area.
 .
.