Displaying Simulation Content | ||
| ||
-
To explore the simulation content:
-
From the
action bar,
select
Choose Content
 .
The simulation content appears. It is divided by content types and displayed in thumbnails. An icon on the thumbnail identifies the type of simulation content: Model
.
The simulation content appears. It is divided by content types and displayed in thumbnails. An icon on the thumbnail identifies the type of simulation content: Model , Scenario
  , or Result
  . A Play control superimposed on the icon indicates that this content
can be animated.
. A Play control superimposed on the icon indicates that this content
can be animated. 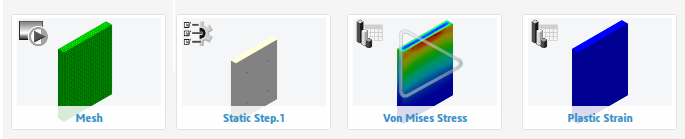
Tip: To ensure that views are that identical when changing content types, select the Reframe option under . Reframe resets all views for easy comparison regardless of previous manipulations such as panning or rotating. In addition, you can animate content types automatically on activation by selecting Launch Animation. Select Keep information panel to keep the information panel open when changing content types. -
If your simulation includes multiple sequences, click one of
the boxes that appear above the thumbnails to select an analysis case.
3DPlay updates the set of available simulation content.
-
Click a simulation content thumbnail. The following types of
content are available:
- Mesh: Display the model with its mesh exposed.
- Material: Display the model with each material assignment color coded.
- Step Name: Display the location of the loads, restraints, and interactions for the selected step.
- Output Results: Display analysis results, including the undeformed model, for the selected variable.
Note: Not all steps and load cases from experience content may be available. If you did not explicitly specify all steps and load cases when generating experience content, 3DPlay can display a subset of steps and load cases. For example, if you have more than three steps, 3DPlay displays the last step only. If you have more than five load cases, 3DPlay displays the first five load cases.The selected content appears in the work area.
-
From the
action bar,
select
Choose Content
-
If the simulation content can be animated, click Play Forward in the
Play panel to run the experiment. The animation plays
once by default, but you can change the loop mode to enable the animation to
play multiple times.
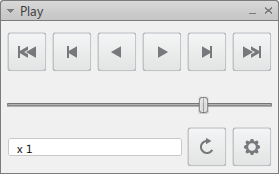
Important: The Play panel appears only for content with simulation data. Tip: The Simulation options command lets you select one or more steps from which you want to animate simulation content. -
To display more information about mesh, material, scenario, or
frequency results (such as its Eigenmodes):
- Select the simulation content that you want to investigate.
-
From the
action bar,
select
Information
 .
Information appropriate to your simulation content selection appears in the panel on the right side of the app. This content includes the following:
.
Information appropriate to your simulation content selection appears in the panel on the right side of the app. This content includes the following:- If you selected a mesh, the Mesh Definition panel displays mesh statistics (including number of elements, element connectivity, and nodes), and information about mesh quality (with the number and color of good, poor, and bad elements).
- If you selected materials, the information panel displays material behavior data for each material in the selected product. This data could include density, isotropic elasticity data, and plasticity data as well as any other material behaviors specified in the simulation domain. Plasticity data such as yield stress curves is displayed as XY plots in the panel.
- If you selected a scenario, the Scenario panel describes the loads, restraints, and interactions present in each step.
- If you select a plot and your analysis includes frequency results, the Eigenmodes panel displays a plot of the frequency for each mode.
-
Show or hide a portion of the simulation content in the
work area
by selecting
Hide/Show
 and select the geometry, as prompted.
A toolbar appears on the right side of the work area with the following actions:
- Show/No Show: Swap between visible and hidden spaces.
- Switch All: Switch visibility for all items.
- Keep Only: Keep only the next selection visible.
- Streamlines: Select streamlines to view or hide. Note: This option is present only when you save streamlines as experience content. Streamlines can be plot-specific or shared. Plot-specific streamlines receive their contours from the specific plot that is active at the time of streamline creation. Shared streamlines are not tied to any plot, are usually color coded, and can be displayed on top of both results and nonresults plots.
- Display All: Show all geometry again (reset).
Note: These actions are described in tips that pop-up when you click "Select geometry to switch between visible and hidden spaces" in the top bar. Click the tips to dismiss them. -
Show or hide the legend for a field output plot by clicking
Show/Hide Legend
 in the
action bar.
The legend is shown by default.
in the
action bar.
The legend is shown by default.
The legend displays the current output variable, step and time, the range of values and contour spectrum, and the deformation scale factor. If an animation is running, this part of the interface is for information only. If no animation is running, you can use this component of the legend to switch the display to a different step and time stamp.
-
Show or hide the extrema (minimum and maximum) in a plot by
clicking
Show/Hide Min/Max
 from the
action bar.
The extrema are hidden by default.
from the
action bar.
The extrema are hidden by default.
-
Click the minimum
 or maximum
 marker to display the extrema values of the plot.
Note: 3DPlay adds a small white dot to the model below the minimum and maximum markers to pinpoint the exact location of the extrema value. This is helpful when the extrema are hidden by a surface. You can also use the Section tool
marker to display the extrema values of the plot.
Note: 3DPlay adds a small white dot to the model below the minimum and maximum markers to pinpoint the exact location of the extrema value. This is helpful when the extrema are hidden by a surface. You can also use the Section tool to help visualize the location when the
extrema are in the interior of a model.
to help visualize the location when the
extrema are in the interior of a model. -
Click Reframe
 on the marker label to reorient the model normal to the
minimum or maximum. Click
Restore
on the marker label to reorient the model normal to the
minimum or maximum. Click
Restore
 to go back to the previous view.
The minimum and maximum settings, such as the number of values and tolerance settings, are based on the content in the app that generates these values, so you cannot customize them in 3DPlay.
Note: When using Show/Hide Min/Max, consider the following behaviors:- Show/Hide Min/Max does not display extrema markers during animation.
- Show/Hide Min/Max does not display extrema markers if the current frame is interpolated. Show/Hide Min/Max is available only for computed frames.
- Show/Hide Min/Max displays only one global minimum and one global maximum.
- The minimum and maximum marker visibility is affected by
Hide/Show
. If
the part of the simulation that contains the global minimum or
global maximum is hidden, 3DPlay displays a new minimum
 or maximum
  for the visible parts of the simulation.
Note: If the global minimum or global maximum occurs over many parts, hiding one part does not result in the use of the dotted icon as the value for the exposed global maximum or global minimum is the same as the value for the hidden portion.
for the visible parts of the simulation.
Note: If the global minimum or global maximum occurs over many parts, hiding one part does not result in the use of the dotted icon as the value for the exposed global maximum or global minimum is the same as the value for the hidden portion. - The minimum and maximum marker visibility is unaffected by
Switch Material
 .
.
-
Click the minimum
-
To apply transparency to the object in the
work area:
- Select the object (or a part of this object) in the work area.
-
From the
action bar,
select
Switch Transparency
 .
.
A toolbar appears on the right side of the work area with the following actions:
- Switch All: Switch transparency for all items.
- Keep Only: Select one or more parts. 3DPlay renders the selected parts solid and displays all others as transparent. Click Keep Only a second time to disable the command.
- Restore: Show all geometry as solid again.
Note: These actions are described in tips that pop-up when you click "Select geometry to switch its transparency" in the top bar. Click the tips to dismiss them. - Optional:
If you display material content or any results plot other than
Plastic Strain, you can switch the material rendering style from a color-coded
display suitable for distinguishing between components to one that provides a
more realistic view:
- Select the object (or a part of this object) in the work area.
-
From the
action bar,
select
Switch Material
.
A toolbar appears on the right side of the work area with the following actions:
- Switch All: Switch materials view for all items.
- Keep Only: Select one or more parts. 3DPlay renders the selected parts realistically and displays all others as color coded. Click Keep Only a second time to disable the command.
- Restore: Show all materials in the color-coded display.
Note: These actions are described in tips that pop-up when you click "Select geometry to switch its material" in the top bar. Click the tips to dismiss them. -
To display a simulation object with a view normal to a plane,
select
Normal View
 .
The simulation object is displayed in the normal view.
.
The simulation object is displayed in the normal view.