Exploring Company Spending

The Overview page allows you to have a global view on expenses and to quickly spot potential savings for similar parts (cluster).

You may also use filters or create custom dashboards to have a more precise view on specific topics (like plant, category, product line).

This task shows you how to:

Access Company Spending Analysis

Go to the Overview page:

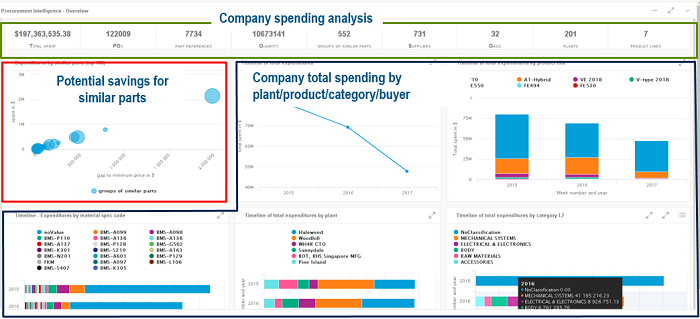
Note that you must have created categories in OnePart to be able to display the chart Timeline of expenses by category.
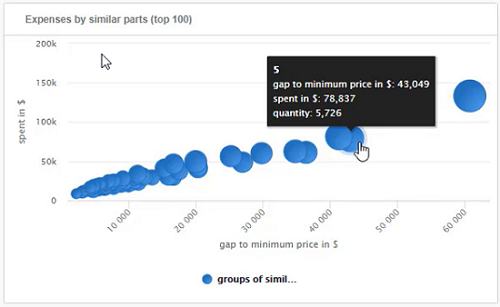
View Potential Savings

The Expenses by similar parts dashboard allows you to investigate potential savings for a given cluster at a glance.

  1. In the Overview page, look at the Expenses by similar parts bubble chart. Each bubble represents a cluster defined in OnePart:

    • The size of the cluster is proportionnal to the number of parts it contains.
    • The height of the cluster in the chart represents the money spent by the company to buy parts belonging to this cluster.

    To spot potential savings, look at the biggest bubbles located at the top right of the chart first.

  2. Click the cluster you want to investigate further.
    Data displayed is now related to the selected cluster only.
  3. Look at dashboards representing timeline of expenses to identify how to better manage your spending.
  4. To have a better a view on potential savings by part, click the Parts link.

    Each part number belonging to the selected cluster is displayed along with the money spent and the potential savings (based on the cheapest price for an equivalent part).

  5. Scroll down to display the total spent and evolution of prices over the years.

Filter Expenses

  1. In the Overview page, click .
  2. In the right pane, select the frame time or topic on which you need to refine.

    The filters you selected are added to the Active filters list. Dashboards are updated accordingly.

    Note that filters are persistent if you navigate to other sections of Procurement Intelligence (vendors, buyers, etc).

Create Custom Dashboards

You can create custom dashboards to quickly access specific data (plant or program for instance) related to parts you are in charge of.

  1. Refine an existing dashboard using filters.
  2. Click > Edit.
  3. Enter a label and a description (optional).
  4. Click OK.
  5. Click to save your modifications.
    The page you created is displayed under My pages in the left hand pane.