Define the Data to Show
-
In the Properties panel, go to
 Data.
Data.
- Select a data query and a Result Set.
Define the Data to Show
Define the Chart Title and Icon
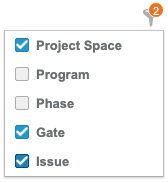
Define the Nodes to Show on the UIBefore you begin: For this visualization, one result set in the
Data > Result set section.
Define the Value ColorsYou can define the colors to apply on nodes depending on the values of a selected field.
Add On-click Actions
You can specify actions to show in the details panel of the Graph view
visualization. These actions display next to the
Add a Drag Button in the Detail Panel
You can add a
| |||||||||||||||||||||||||||||||||

 , and
select a translation key. You define keys and translation values in the
, and
select a translation key. You define keys and translation values in the
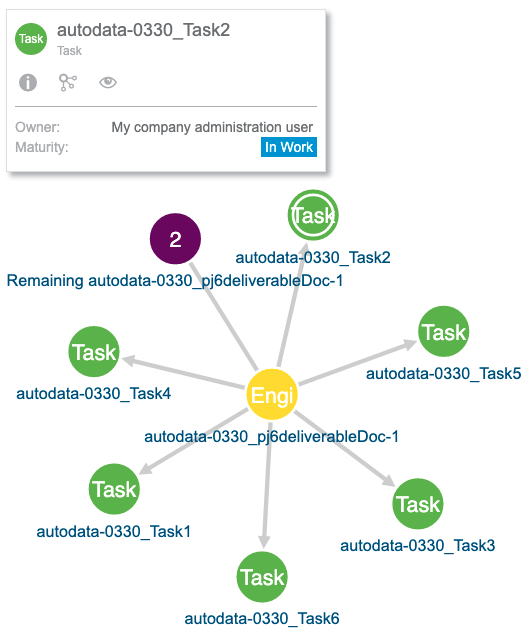
 expand a node. When the number of related nodes exceeds this limit, the related node
indicates the number of remaining nodes.
expand a node. When the number of related nodes exceeds this limit, the related node
indicates the number of remaining nodes.  .
.
 icon in
the previous screenshot).
icon in
the previous screenshot).
 to add a new
effect.
to add a new
effect.
 drag button in the
detail panel for users to drop objects in another
drag button in the
detail panel for users to drop objects in another