Define the Data to Show
-
In the Properties panel, go to
 Data.
Data.
- Select a data query and a Result Set.
Define the Data to Show
Define the DimensionYou can configure a dimension by selecting a field. By default, Data Perspective Studio suggests the dimensions available in the result set.
Define the MeasureYou can configure the measure to show in the visualization. By default, Data Perspective Studio suggest the measures available in the data query result set.
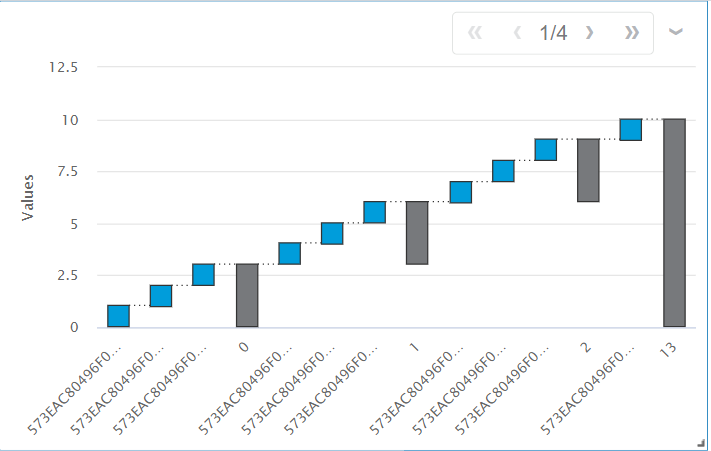
Define Specific Waterfall OptionsYou can configure several options specific to Waterfall charts, that is, a final sum bar and intermediate sums.
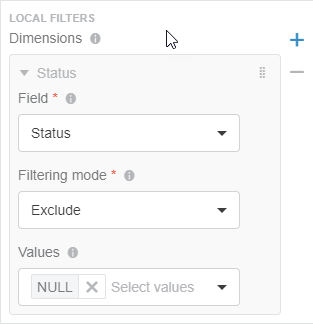
Reduce the Scope of Dimensions with Local FiltersFor a visualization that displays data for a dimension (for example, in a chart axis), it may be useful to focus on specific values for that dimension. You can do so using a local (internal) filter. For example, if you have a
Define the Chart Title and Icon
Add On-click ActionsYou can specify actions to run when you click the chart.
Add Actions to the Actions Menu
You can add actions to the list of available
| ||||||||||||||||||||||||||||||

 , and
select a translation key. You define keys and translation values in the
, and
select a translation key. You define keys and translation values in the

 to add a new effect.