Data Query Tips and Tricks | ||||||
|
| |||||
See Intermediate Results My Data Query
When creating a data query, the good practice is to put a RESULT SET
operator after each operator. Verify that what comes out of the preceding operator is
conform to your expectations. Once the output is good, you can remove the RESULT
SET operator.

Make Aggregations
You can make aggregations at several levels with several methods.
| # | Method | Description | |
|---|---|---|---|
| 1 | AGGREGATE transformation operator |
You can use AGGREGATE operators in the data query. However:
Recommendation:
Avoid adding multiple AGGREGATE operators.
|
|
| 2 | Result Set terminal operator |
You can define several aggregations in a Result Set at the end of the data query. This is very useful to declare several aggregations once and use them for several visualizations at the visualization level. Recommendation:
Choose this
method to mutualize your aggregation definitions.
|
|
| 3 | Aggregation at the visualization level |
You can specify an aggregation in the Visualization Properties panel, from the Measures section. This is useful if the aggregation is specific to the visualization.
|
Use Item Instead of Tuples
With the Semantic Graph Index, it is better to manipulate items rather than tuples, for performance reasons. That is why it is better to keep item objects as close as possible to the end of the data query. It is therefore different from SQL, where you typically transform items in Tuples to reduce the number of attributes.
The following use case shows how you would proceed in SQL, and how to do it more efficiently in Semantic Graph Index.
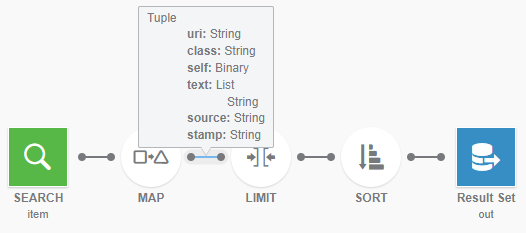
To reproduce an SQL query, you would add the MAP with its item objects at
the beginning of the query. 
In Data Perspective Studio data queries, avoid adding tuple transformation as in SQL. In SQL, you choose only the
interesting columns and make transformations.
In Data Perspective Studio data queries, try to put the MAP operator and object items at the end of
the chain. The goal is to make the transformation as close as possible to the output.
Enhance the Data Query Performance
When you ![]() Run your data query configuration, you can use the
Run your data query configuration, you can use the ![]() Profile debugging tool.
Profile debugging tool.
| Important: Under Params, enter your input parameters, if any. |
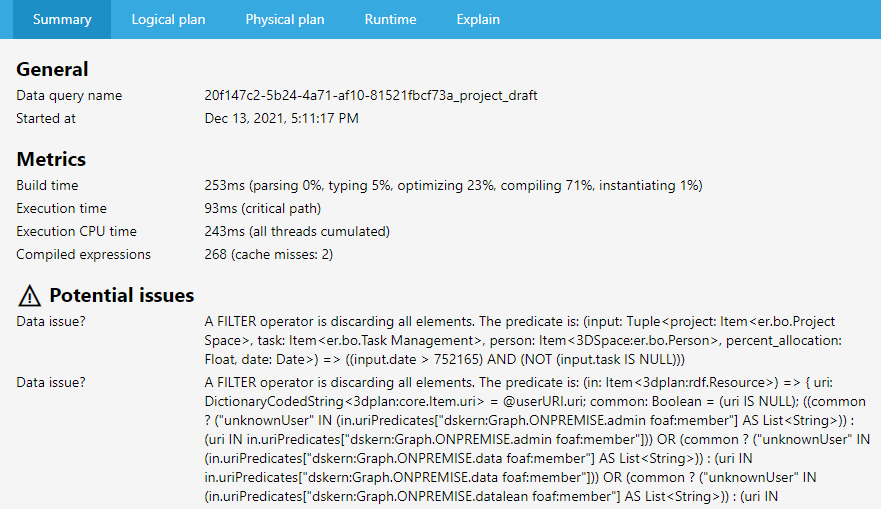
When you click ![]() Profile, you get a view with several tabs.
Profile, you get a view with several tabs.
The Summary tab lists all potential issues. 
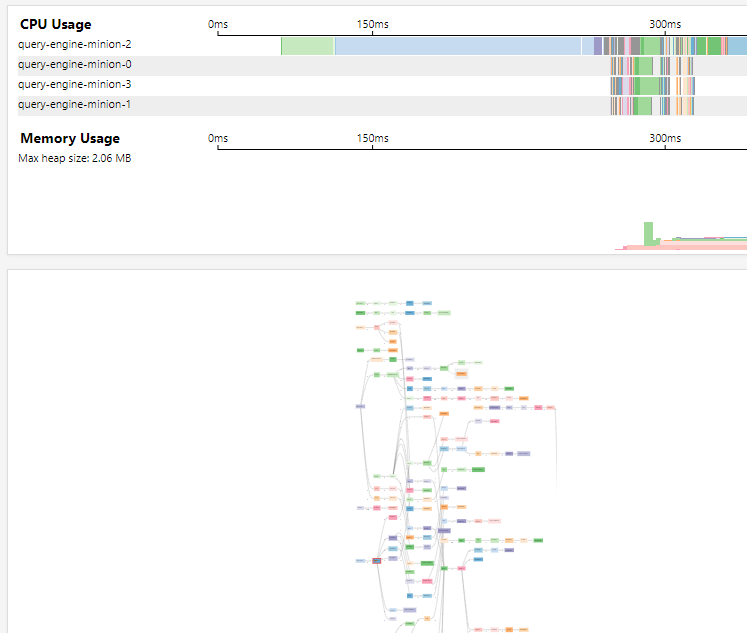
The Logical plan tab shows the CPU usage per thread and the Memory
Usage. 
Tips:
If you zoom in the Graph view, you can see icons indicating operator issues
that may have an impact on performance. For example, flame icons represent heavy CPU
consumption, elephant icons represent heavy memory consumption. You can also see the number
of objects coming out of the operators.  |