Adjust Plot Appearances
You can modify the background, layout, and title of an XY plot
display.
-
Right-click anywhere in the plot window, and select
Options.
You can also, from the Plot
toolbar, click
Options
 . .
The
Options dialog box appears.
-
Select the item
Plot.
-
Modify the background options.
- To modify the color of the background fill, select the
Show fill check box, and select a color in
the color list.
- To remove the background color, clear the
Show fill check box.
- To modify the border of the plot, select the
Show border check box; and modify the
color, the thickness, and the line type.
- To remove the border, clear the
Show border check box.
-
Modify the title options.
- To add a plot title, in the
Title text box, type the title, and select
a color and font.
- To display a background, select the
Show background check box, and select a
color in the color list.
- To show a border, select the
Show border check box; and select a color,
the thickness, and the type of border.
-
To reset to default values, click
Reset.
-
To set as default values, click
Set as Default.
Edit Charts Layout
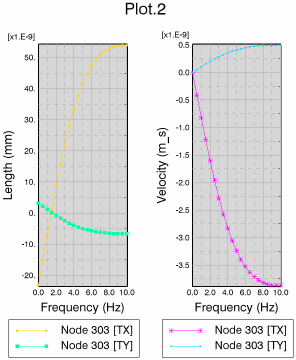
If you have several charts in a plot, you can edit the layout.
Before you begin: The charts must not be synchronized, synchronized charts always
use a horizontal layout. See next section.
-
Right-click anywhere in the plot window, and select
Options.
You can also, from the Plot toolbar, click
Options
 . .
The
Options dialog box appears.
-
Select the item
Layout.
-
In the
Charts layout group, select from the
following alternatives:
-
To reset to default values, click
Reset.
-
To set as default values, click
Set as Default.
Synchronize Charts
If multiple charts are open in a plot, you can synchronize the
X-axes for all charts. When charts are synchronized:
- The value range on all X-axes is the same.
- If a view manipulation changes the X-axis in one chart, the X-axes
of the other charts are updated accordingly. (Y-axes are not synchronized
between charts.)
- If you activate a cursor along the X-axis in one chart, the cursor
is also activated in all other charts.
Charts can be synchronized only if one of the following conditions is
met:
- The X-axes of all charts have the same units.
- The X-axes of all charts are unitless.
- All charts use a common X-axis.
Also, each chart on the plot can have only one X-axis, though multiple
curves may appear on each chart.
-
To perform an X axes synchronization without selecting options,
from the Plot toolbar, click
Synchronize/Unsynchronize charts
 . .
The command works in toggle mode.
-
To perform a chart synchronization with options, do the
following:
-
Right-click anywhere in the plot window, and select
Options.
You can also, from the Plot toolbar, click
Options
 . .
The
Options dialog box appears.
-
Select the item
Plot - Layout.
-
From the
Charts synchronization group:
- To synchronize the charts, select
Synchronize X axes.
- To display an X-axis on every chart, select the
Show X axes check box. (If the
Show X axes check box is cleared,
only one single X-axis is displayed on the bottom chart.)
-
To reset to default values, click
Reset.
-
To set as default values, click
Set as Default.
The charts remain synchronized until one of the following
happens:
- The
Synchronize X axes check box is cleared.
- A curve whose X-axis has different units than the synchronized
axes is added to a chart.
- A chart whose X-axis has different units than the synchronized
axes is added to the plot.
- A new X-axis is created in a chart via the
Options dialog box.
|
 .
The Options dialog box appears.
