Plotting a Track on a Graph | ||||
|
| |||
-
Select a Track and in the Simulation section of the action bar, click Path Planning
 .
.
-
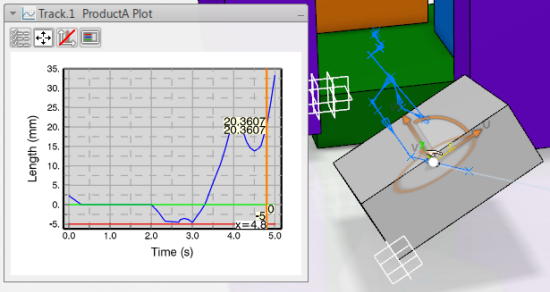
In the Simulation section of the action bar, click Track Plot
 .
The Track Plot panel appears showing the minimum distance curve.
.
The Track Plot panel appears showing the minimum distance curve. -
Move the line handle to a specific time.
The Track simulation player is activated. The simulation player cursor moves to the same time. Any moving objects in the work area also move to the position corresponding to this time.