Fill Rate | ||||
|
| |||
A scope is defined as the intersection of one or more of the following dimensions, at any chosen level of aggregation:
- A sales segment,
- An item (product category, family...), and
- A stock location (region, country, …).
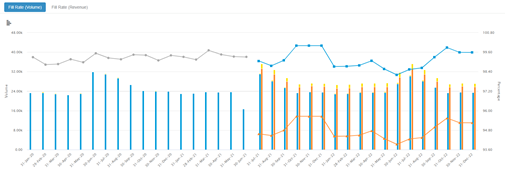
With the Fill Rate report, you can review fill rate performance from the Volume or the Revenue perspective.

The chart is split into two parts in time:
- The actual fill rate in the past and in the current period, and
- The projected fill rate in the current and future periods.
For periods with actuals, you see:
- Total sales: The total volume sold for the considered Scope and period.
- Lost sales: The gap between the total ordered volume and the total sales.
- Fill rate %: The total order quantity over total sales quantity.
For periods with projected performance, you see:
- Constrained forecast: The total projected volume of sales for the considered Scope and period, considering supply chain capacity constraints and material availability.
- Unfulfilled demand: The gap between the constrained forecast and the unconstrained forecast.
- Projected fill rate %: The constrained demand forecast over the unconstrained demand forecast.
Note:
The projected performance data is available per scenario (You can compare the
scenarios side by side in the chart).
If you are investigating a defined fill rate target percentage for the supply chain scope, it is shown in the chart.