Sales | ||||
|
| |||
A scope is defined as an intersection of one or more of the following dimensions, at any chosen level of aggregation:
- A sales segment,
- An item (product category, family...), and
- A stock location (region, country, ...).
With the Sales report, you can view the charts for:
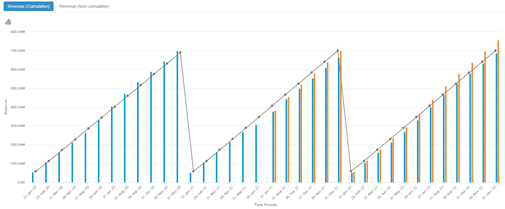
- Revenue (cumulative): You can review the sales performance with respect to sales revenue
target, with a cumulative view over the yearly sales plan.

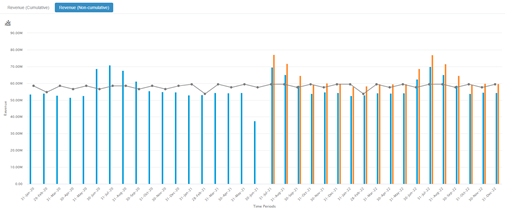
- Revenue (non-cumulative): You can review the sales performance with respect to sales
revenue target, with a view per period over the yearly sales plan.

- The actual sales in the past and in the current period, and
- The projected sales in current and future periods. This data is available per scenario, which enables you to perform a side-by-side scenario comparison for the considered scope.
While you can see the revenue in periods with actual sales, in periods with projected performance, you can see the projected revenue.
If you are investigating a defined sales target for the supply chain scope, it is shown in the chart.