Define Dynamic Date Facets
Dynamic date facets automatically adjust the granularity of the date display,
according to the maximum number of facet values specified, and the date range for your search
results.
-
Follow the steps to create a new facet, selecting Dynamic date
for the Type field. For details, see Create Facets in the Search Logic.
-
For Expression, define an expression based on a RAM-based
index field for this facet.
-
For Units, select the granularity you want to be able to
display. For example, select Year, Month
and Day.
-
(Optional) In Max. categories, change how many date values
this facet can display. By default this is 40.
The lower this number, the more likely dates display at a lower granularity (years
instead of months, or weeks instead of days). Displaying lower-granularity dates is
useful when representing large date ranges in widgets.
-
Select Enable ISO 8601 compliance, to get weeks starting on
Monday and a few rules determining the first and last week of each year. Use compatible
Output formats. Typically, use
%V instead of %U
otherwise week numbering is not consistent with grouping.
-
Click Apply.
-
In the Mashup UI, perform a search that returns a date range that spans
several months or weeks.
As you refine on these search results, the dynamic date facet display on the
Refinement panel. For an example of how dates adjust when displayed in a chart, see Generate Missing Dates, Step 8 and
Step 9.
Generate Missing Dates
-
In the dynamic date facet setup options, for Sort by check
that Date is selected.
-
Select Generate missing intervals, if not already
selected.
-
Click Apply.
-
In Mashup Builder, add a line chart widget to your /search page:
-
Go to the search page and select the Design view
-
In the Widgets panel, expand Visualizations > Charts,
and drag the Line Chart widget on to the page.
-
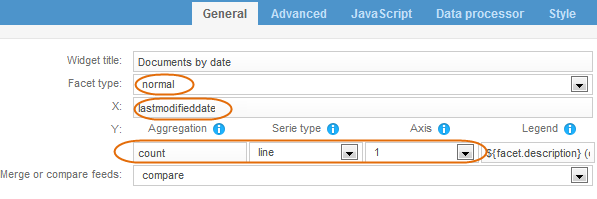
Click the header of the Line Chart widget to fill in the required properties:
-
For Facet type, select
normal.
-
For X, select the dynamic date facet from the list at
left. In our example, this is lastmodified date.
-
Under Aggregation, select
count.
-
For Chart type, select line.
-
For Axis, select 1.

-
Click Preview to make sure that the chart looks as
expected.
-
Click Apply.
-
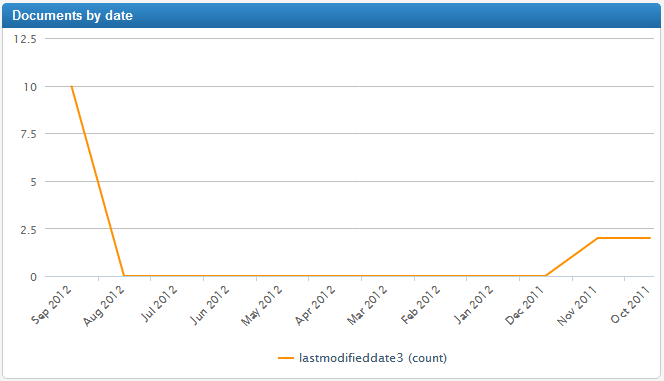
In the Mashup UI, perform a search that returns a date range that you
know includes some missing dates.
For our example, in an 11-month period, we only have values for Sept 2012, Nov 2011,
and Oct 2011, but the line remains unbroken.
Thanks to the Generate missing intervals option, the Line
Chart displays the missing months on the X-axis, with zero values.

Note:
While the chart widget displays auto-generated missing dates, the Refinement
panels does not. It only displays facet dates that exist in the underlying index
field.
-
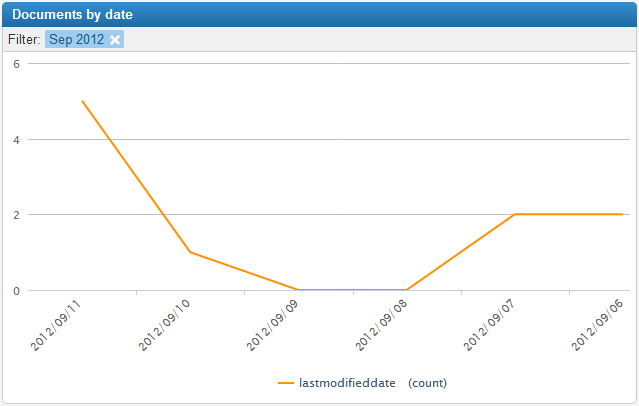
Refine your search results to shorten the matching documents’ date range.
In our example, we refine on Sept 2012. Once again, missing dates (Sept 9 and 8) are
auto-generated and populated with a value of 0.
Also, notice how the date display becomes more granular as the time period gets
shorter. Before that, the X-axis displayed points as MMYYYY. Now it displays
YYYY/MM/DD.

Change the Display Format for the Dates
The output format is defined using UNIX date syntax.
|


