Enable reporting on your Mashup Builder applications
The edm-mashup-ui-reporting reporter collects data relative to task execution and to CPU activity on the Mashup UI. For example, when a user queries a page, the reporter retrieves data such as the execution and CPU time of pages, widgets and triggers.
Once configured in the Administration Console, this reporter must be enabled in the Mashup Builder > Application > Application Properties menu.
As for all reporters, the information collected by the edm-mashup-ui-reporting reporter can be exported to CSV, JDBC and SQLite repositories, to make reports with external tools. It can also be sent to a Push API publisher if you want to index this data and use it like other indexed Exalead CloudView data.
The difference with the other reporters, is that you can directly display collected information into a timeline chart, accessible when the debug mode is enabled.
-
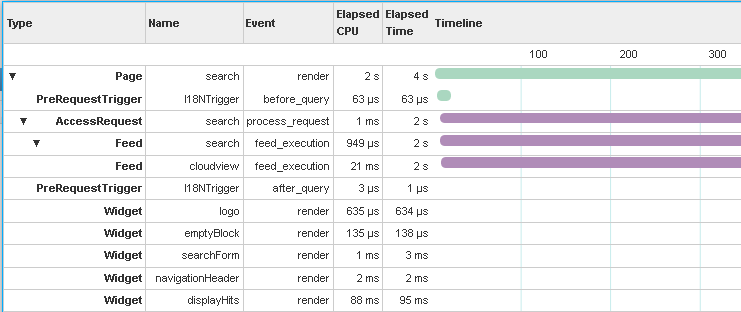
Click the Timeline tab.
A window displaying a timeline chart opens (see the following screenshot example).