-
From the
Simulation section of the action bar, click
Show Gantt Chart
 . .
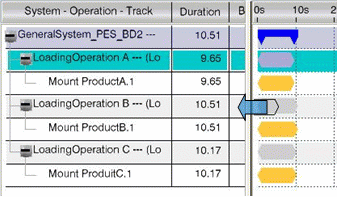
The
System-Operation-Track Gantt chart appears.
-
Select the symbol representing LoadingOperationA in the chart and
drag it to LoadingOperationB.
An arrow appears to the left of the symbol.
-
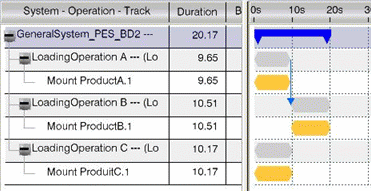
Drop it before LoadingOperationB.
A product flow constraint is created between
LoadingOperationA and LoadingOperationB.
-
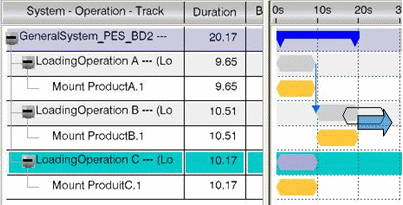
Select the symbol representing LoadingOperationC in the chart and
drag it to LoadingOperationB.
An arrow appears to the right of the symbol.
-
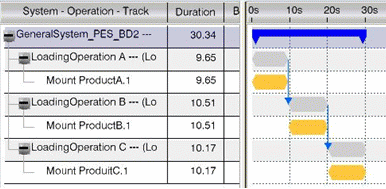
Drop it after LoadingOperationB.
A product flow constraint is created between LoadingOperationB and
LoadingOperationC.
Notes:
- A product flow can be deleted by right-clicking the link in the
Gantt chart, and selecting Delete constraint.
- The product flow link is displayed in the Gantt chart. The color of
this link is determined by the Display
Links options in
.
- When you right-click any row of the Gantt chart, the
Export as XML contextual command lets you
generate an XML file containing information such as object name and
type, begin time, and duration.
- When creating a product flow
between two operations only, right-click the arrow, then click
Constraint Properties on the context menu to open the
Constraint Properties
 panel and manage the product flow. It allows you define
attributes such as delay, dependency, and category. For more
information, see Constraint Properties Panel. panel and manage the product flow. It allows you define
attributes such as delay, dependency, and category. For more
information, see Constraint Properties Panel.
|
 > Preferences > App Preferences > Simulation > Digital Manufacturing Apps Common Services
.
> Preferences > App Preferences > Simulation > Digital Manufacturing Apps Common Services
.