Displaying Legend

You can see at a glance the different available legends for the selected simple feature (point, line, or polygon).

This task shows you how to:


Before you begin:

The legend is not exported in snapshots (generated through the Capture Snapshot or Share Snapshot command).

Display Legend for Datasets with SLD

You can display legend for datasets with SLD information.

  1. Create a dataset with SLD and add it to your experience.


  2. From the View section of the action bar, click Legend .
  3. Right-click the dataset in the tree and select Display Legend.
  4. In the Legend panel, click Update.
    The Legend panel displays a From Import area containing specific information about the selected data layer and the corresponding value for each color on the map.

    The legend name corresponds to the sld:Title contained in the sld:Rule in the SLD associated to the dataset. For instance:
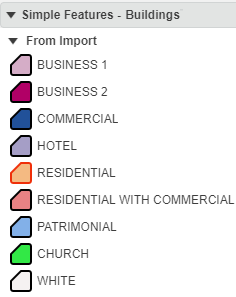


    Each type (polygon, line, point) is identified by a specific visual feedback in the panel:

    Symbol Type
    Polygon
    Line
    Point
    User-defined icon

  5. Right-click another dataset with SLD in the tree and select Display Legend.
  6. In the Legend panel, click Update.
    The Legend panel now displays the legend of the newly selected simple feature in addition to the formerly selected item.
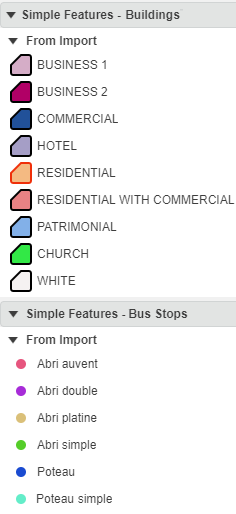
  7. To hide the legend for a specific item, right-click it in the tree, select Hide Legend and then click Update in the Legend panel.
  8. To close the Legend panel, click Legend from the View section of the action bar.
Display Legend for Simple Styling

You can display legend for simple attributes.

  1. Select a dataset then click Properties from the standard section of the action bar.

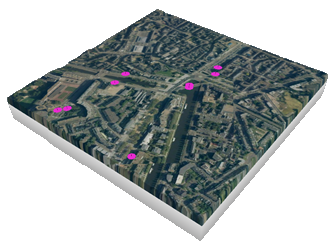
    In our example, we will modify the pink color for points.

  2. From the View section of the action bar, click Legend .
    The Legend panel displays a From User area containing the legend for the simple styling:

  3. Click the color box then select a new color for the dataset.
    The experience is modified accordingly.

  4. In the Legend panel, click Update.
    The Legend panel is refreshed to reflect the modified styling:

  5. To hide the legend, right-click the dataset in the tree, and then select Hide Legend and then click Update in the Legend panel.
  6. To close the Legend panel, click Legend from the View section of the action bar.

Display Legend for Advanced Styling

You can customize the map and toggle between styling attributes.

  1. Select a dataset then click Properties from the standard section of the action bar.

    In this example, we define ranges for a numerical attribute using the Range method. See Defining Advanced Properties for more information about the methods available for defining advanced styling.

  2. In the Attributes area, click the button next to the property to be customized.
  3. Click then select Set attribute.
  4. In the Method list, select Range.
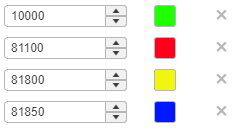
  5. Set the appropriate values.
    For instance:

  6. Close the panel.
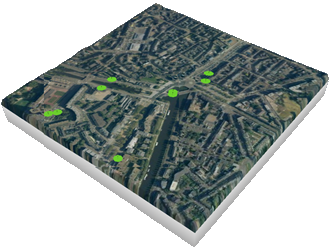
    The experience is colorized accordingly.

  7. From the View section of the action bar, click Legend .
  8. Right-click the modified dataset in the tree, then select Display Legend.
  9. In the Legend panel, click Update.
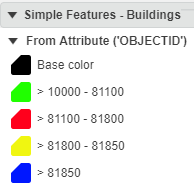
    The Legend panel displays a From Attributes area containing the legend for the defined styling:

  10. Select another dataset and define advanced styling, then right-click the dataset and select Display Legend.
  11. In the Legend panel, click Update.
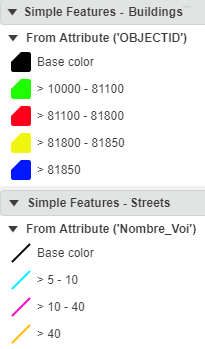
    The Legend panel is refreshed to display the legend for the new styling attributes.

  12. To hide the legend for a specific item, right-click it in the tree, and then select Hide Legend and then click Update in the Legend panel.
  13. To close the Legend panel, click Legend from the View section of the action bar.