-
From the Analysis section of the action bar click Isophotes Mapping
Analysis
 . .
-
In the Type Option area, select Cylindric
Mode
 . .
-
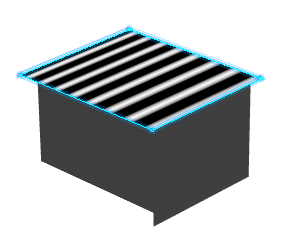
Click a surface in the work area.
The Isophotes representing cylindrical zebra
stripes are applied on the surface.
-
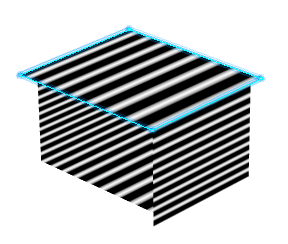
Select Analysis mapping on part
 . .
Isophotes are displayed on all surfaces of the part, irrespective of whether
they are selected or not.
Note:
If you want isophotes on all of the part in the work area, use this method of global selection
rather than using a trap.
-
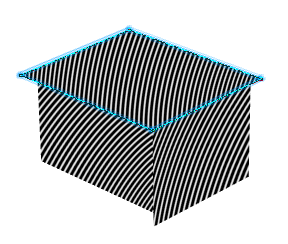
Select Spheric Mode
 . .
Isophotes representing spherical zebra stripes are applied on the
surface.
-
In the Zebra parameters area, select
Robot
 . .
The Robot is repositioned at the center of the
reference planes and a representation of the spherical
3D handle is displayed with its center located at the base of the Robot. 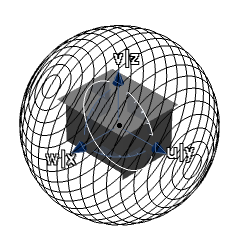
-
Select Cylindric Mode
 again. again.
The 3D handle changes to a cylindrical shape. 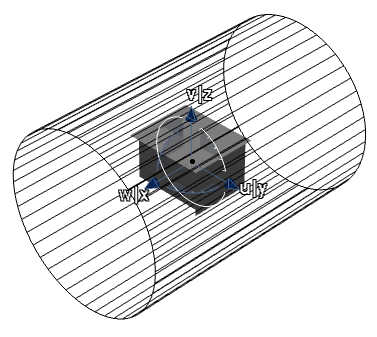 - In the Zebra parameters area select
Hide the 3D manipulator
 . .The 3D handle disappears, but the Robot remains in the work area. -
Manipulate the Robot to modify the orientation of the hidden 3D handle.
Because the 3D handle orientation has changed, the orientation of the isophotes also
changes. 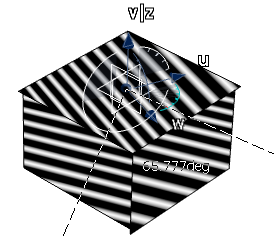 -
In the Type Option area, select User
eye
 . .
Note that Point Mode is
selected automatically. is
selected automatically.
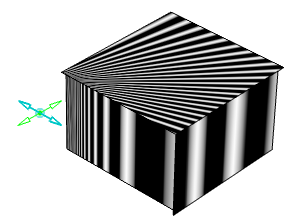
Note:
If you right-click the Eye user handle, a context menu appears which allows you to
Edit its position or Keep this
point.
- Optional:
Create the analysis by specifying accurate values for the
Zebra parameters.
-
To specify the step value for Number of stripes
(Density), Width of stripes (Thickness), and
Color transition (Sharpness), right-click the
box and select Change step.
-
To enter a new step value, right-click the box and select
Change step > New one.
-
To specify the range value for Number of stripes
(Density), right-click the box and select Range >
Edit.
In the Range definition dialog box, enter
values for Inf. Range and Sup.
Range.
-
To add range values, right-click the box and select Range
> Suppress. Right-click Number of
Stripes box and select Add
Range…. In the Range definition dialog
box, select the Inf. Range and Sup.
Range check boxes and enter values.
-
Click OK. The analysis appears in the tree and updates automatically when you modify
the input elements.
|