Checking Connections Between Curves | ||||||
|
| |||||
-
From the Analysis section of the action bar, click Connect Checker Analysis
 .
.
- Select Quick display mode.The quick analysis mode's options are displayed.
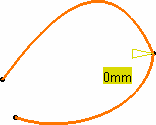
If a connection deviation is greater than a threshold value, text is displayed next to the connection point indicating the value and units of the connection deviation.
The color of the text depends upon the type of deviation.
In this example, the text on the geometry disappears because the distance between the two curves is smaller than the G0 threshold value.
-
Select the continuity analysis type to display.
- Overlap Defect : overlapping elements (selecting this disables the other analysis types)
- G0 continuity: continuity in point
- G1 continuity: continuity in tangency
- G2 continuity: continuity in curvature
- G3 continuity: continuity in curvature tangency
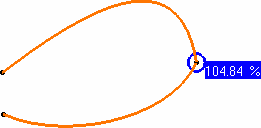
In this example, G1 continuity is selected and a text is displayed on a green background (as defined by default for the Tangency criterion) to indicate that the G1 continuity (tangency) criterion is not respected, because the first text displayed is the one for which the set tolerance is not complied with. You can then increase the Tangency value, or modify the geometry to comply with your needs.
- Modify the tolerance values, or the geometry to comply
with the tolerances.For example, if you modify the Tangency value to set it to 16 degrees, the geometry instantly reflects the compliance with the new value.
- Optional:
Double-click the Curve Connection Analysis from the specification tree to edit it.
- You can analyze internal edges of a element, such as a Join for example,
by selecting only one of the initial elements:

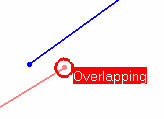
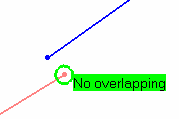
- Use the Overlapping mode to highlight where, on
the common boundary, the two curves overlap. When Overlap
Defect is selected, other analysis types are
deactivated. In Full mode, a text is displayed indicating whether the
curves overlap.
- You can analyze internal edges of a element, such as a Join for example,
by selecting only one of the initial elements:
| Important: The curve connection checking analysis is permanent; it is retained in the tree for later editing and on the geometry until you reset or delete it. |