Checking Connections Between Surfaces | ||||||
|
| |||||
-
From the Analysis section of the action bar, click Connect Checker Analysis
 .
.
- In the Type area, select the type of connection you want to check.
- Curve-Curve Connection

- Surface-Surface Connection

- Surface-Curve Connection

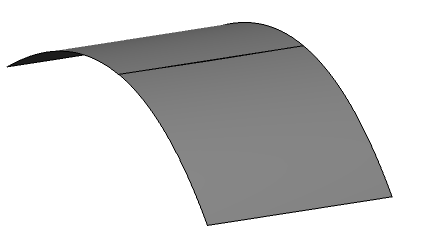
Note: If you select one of these connection types, the analysis will be done in explicit mode. If you do not make a selection, the analysis will be done in implicit mode.In this example, Surface-Surface Connection is
selected because we are analyzing only the connection between two
surfaces. - Curve-Curve Connection
- Select Quick display mode.
The quick analysis provides a simple visual indication of connections which exceed the threshold values for each selected continuity analysis type.
-
Select the continuity analysis type to display.
- Overlap Defect: overlapping elements (selecting this disables the other analysis types)
- G0 continuity: continuity in point
- G1 continuity: continuity in tangency
- G2 continuity: continuity in curvature
- G3 continuity: continuity in curvature tangency
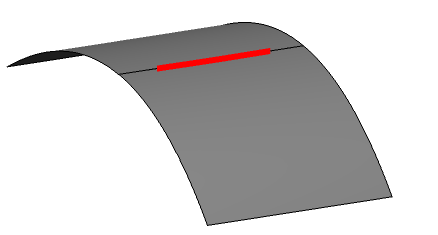
Note: Depending upon your selection in the Type area, you may be able to select more than one analysis type.In this example, G0 continuity is selected.The visual representation of the analysis appears on the elements.
In the example, the thick red line indicates all points that are separated by a gap which exceeds the threshold value for G0 continuity, which in this example is set at 0.1 mm.
The Max Deviation area at the bottom displays the maximum values of the G0, G1, G2 and G3 continuities.
-
Optional: If you are analyzing elements which have been joined
(using a join or match command) and you want to analyze the internal
connections, select Internal Edge
 (this
command is by default unselected).
(this
command is by default unselected).
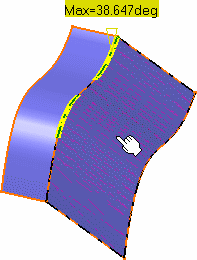
- Clear Quick display mode to display the full mode's options, and then select Comb
 and Envelope
  .
.The thick red line of the quick analysis is replaced by a comb of spikes bounded by an envelope.
The color of a spike indicates whether the connection at the position of the spike is below the threshold value and the length of the spike indicates the magnitude of the discontinuity.

- In the Information area, select MinInfo
 and MaxInfo
  .The minimum and maximum values of the analysis are displayed on the element.
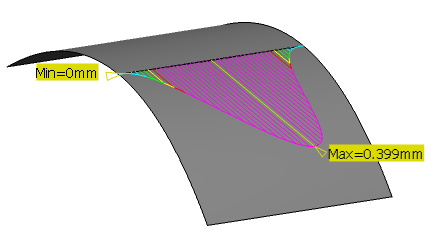
Important: The full result is only available with the Generative Shape Design product. - Adjust the analysis color scale on the element:
- In the Display area, select Full Color Scale
 .The color scale dialog box is displayed.
 - In the color scale dialog box, select the Auto Min Max check box.
- The maximum and minimum values in the dialog box are set according to the values detected on the element.
- The analysis colors are updated to match the color scale in the dialog box.
Note: To access the Edit and the Unfreeze contextual commands for a color and a value on the color scale, ensure that the Auto Min Max check box is cleared. - In the Display area, select Full Color Scale
Tips:
|
| Important: There may be a tangency discontinuity while a curvature continuity exists. This may appear for instance in the case of two non tangent planar surfaces. |