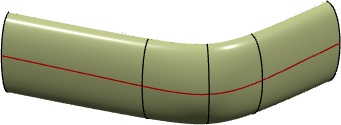
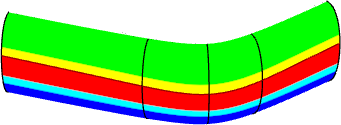
Analyzing Using a Split Curve | |||||
|
| ||||
Note:
If the quality of the shaded analysis display is not
satisfying, select the following in
:
- Highlight section: Glow
- Prehighlight section: XOR


