-
Right-click anywhere in the chart area, and select .
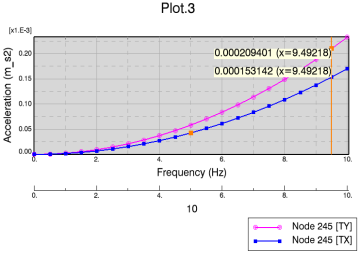
A vertical line appears by default in the left of the X-axis. 
-
To move the vertical line, do any of the following:
- Position the cursor on the vertical line and move it.
- Use the left arrow and right arrow keys to move the vertical cursor.
Notes:
- The display units are shown for the values on the vertical cursor.
- The vertical cursor is always within the visible plot if you pan or zoom. It may go to the left edge or to the right edge of the chart, but does not leave it.
-
To deactivate this option, right-click anywhere in the chart area, and select .
If you have several curves and X-axes, the X coordinates are displayed at each intersection point between the curves and the vertical line.

|