About XY Plot | ||||
|
| |||
XY plot can be used to visualize, for example:
- Probe results in the Mechanical Systems Experience app.
- Watchlist results in the Behavior Experience app.
The following are the different elements of a simple plot:

- Plot Note: The plot is an immersive panel.
- Plot toolbar
Notes:
- The content of the toolbar differs between apps.
- The toolbar is not present in the Mechanical Systems Experience app.
- Axis
- Axis title
- Label
- Legend
- Title
- Chart Note: Some apps may have more than one chart in the same plot.
- Curve
- Cursor along x-axis (vertical cursor)
The plot and each part of the plot can be modified:
If several curves are displayed in the same chart with different magnitudes and different axes, when you pass the cursor over a particular curve, the curve and its associated axes are highlighted.
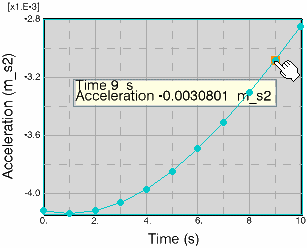
When you pass your cursor over a curve point, the
corresponding values are displayed:
