-
Position the cursor at one corner of the area to be enlarged, click and drag the cursor to the opposite corner, and release
the cursor.
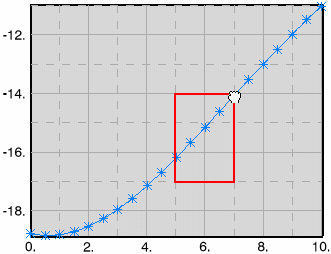
The curve view is enlarged and the axis values are updated to match the data you select. 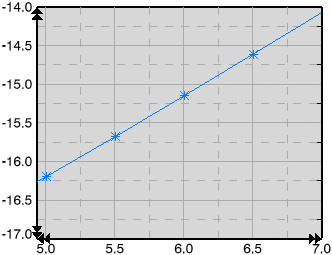 - You can repeat Step 1 a number of times, enlarging more and more.
For each enlargement you reach, a zoom viewpoint is created and stored.
- To zoom out to the previous zoom viewpoint, from the Plot toolbar, click Zoom back to previous state
 . .The chart is zoomed out to previous zoom viewpoint. - You can zoom in and zoom out as you like, new zoom viewpoints are created and stored when you reach new enlargements.
-
To
reframe to the entire chart, you can do any of the following: right-click anywhere in the chart area, and select .
- Double-click an empty space in the chart.
- Right-click an empty space in the chart, and select .
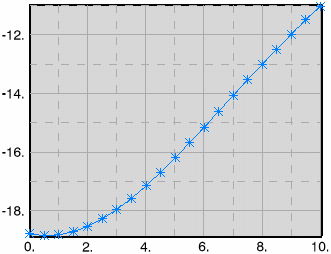
This action results in: - The chart is reframed.
- The list of stored zoom viewpoints for that chart is deleted.
|