Risk Matrix | ||
| ||
Matrix Details
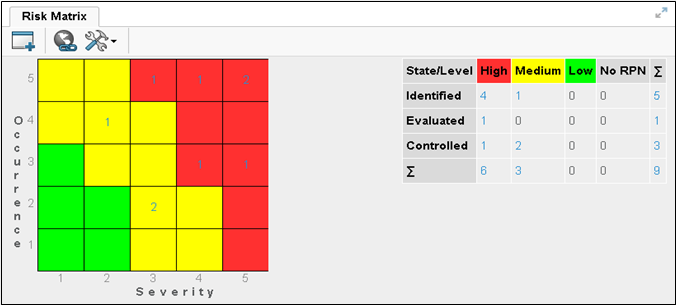
The matrix is displayed in the form of a 5x5 grid. Each cell of the grid corresponds to the value obtained by calculating the RPN (the product of the assigned Severity and Occurrence).
The grid below shows some grid values, corresponding to the 1-5 range that is possible for both Severity and Occurrence:

The cells of the grid are color-coded, depending on the value of the RPN. Each cell shows the number of hazard objects that exist having that RPN as the value. The number is a link to the table of hazards in the Hazards tab, which shows only the objects having severity and occurrence values corresponding to the clicked cell. For a description of the Hazards table, see Hazard Details.
To the right of the grid is a table summarizing the states of the hazards for various levels. The table has rows for Identified, Evaluated and Controlled, which correspond to the states and columns High, Medium and Low, which correspond to the risk level (based on RPN, using the same risk level categorization as the risk matrix). The "No RPN" column shows all hazards that do not yet have an RPN value. A sum of the items in each row and each column is also shown. Each cell value is a link that updates the hazards table in the Hazards tab, showing only the objects corresponding to the clicked cell.