About Plot Layouts | |||||
|
| ||||
By default, Model Plots mode displays only one plot at a time. However, there are many situations where you might want to display multiple plots at once. For example, you might want to display the same model from different angles or plot contours or symbols for several different output variables in the same analysis. You can display multiple plots by first enabling display of plot layouts from the Plots Layout dialog box. Once Plots Layout mode is activated, you can create new plots or activate existing ones from the tree. Any new plots you create are then tiled according to the specified options.
There are two types of plot layout: spread layouts, in which the plots are spread out along
an axis or in a plane; and superimpose layouts, in which all active plots are displayed at the
same location. Spread layouts enable you to visualize several types of data at the same time.
Superimpose layouts can be helpful when you want to examine deformation by showing an
undeformed and deformed plot in close proximity. The following image illustrates the two
different layouts: 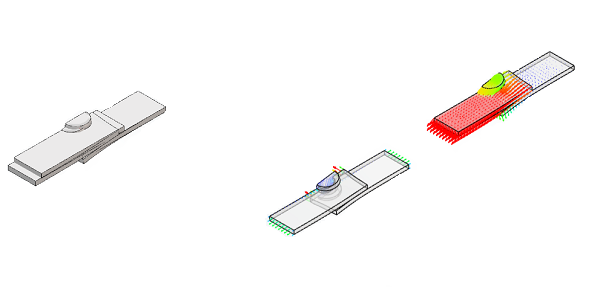
Above left, the two lap joints are superimposed one on top of the other to show the undeformed model and the deformed model for a selected step. Above right, the two models are laid out in a spread pattern along the X-axis, a specified distance apart. In this spread pattern example, the reaction force vectors are displayed on one lap joint, while the displacement vectors are displayed on the other lap joint.
Both spread layouts and superimpose layouts display all of the active plots. You can activate or deactivate plots from the Feature Manager.