About Charts | ||
| ||
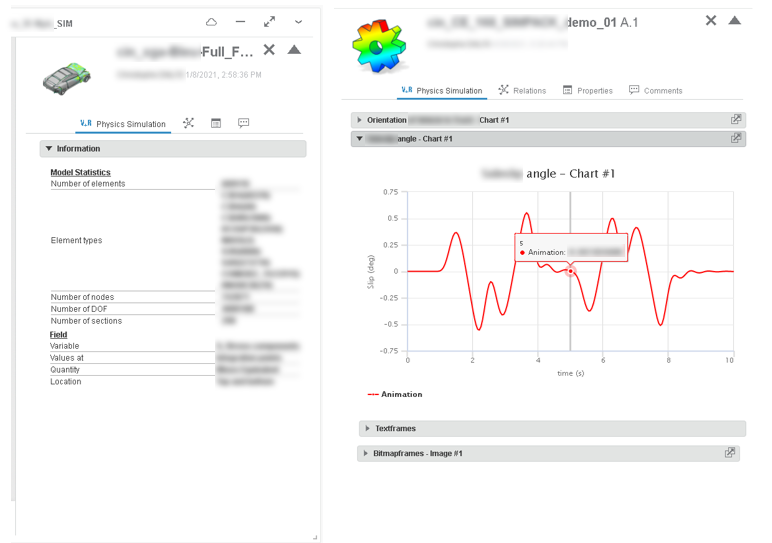
Physics Simulation Review renders charts only once. However, you can extract charts
from the side panel to a dedicated panel that you can reposition anywhere. In the example
below left, the side panel displays basic simulation results information. Below right, the
side panel displays a chart.
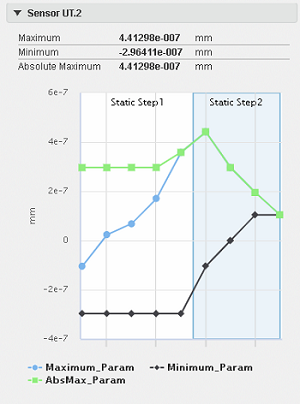
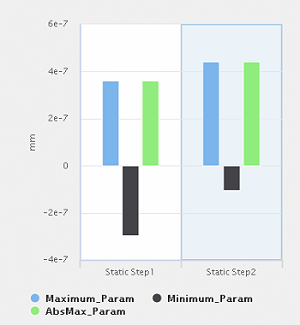
There are two forms of charts in the side panel: X-Y plots and bar charts.
X-Y Plots
You can use X-Y plots to display sensor information where each sensor parameter displays as
a curve defined by X- and Y-values. At the top of the plot, the legend displays the sensor
value for the current frame. The step names are displayed directly in the chart area. 
Bar Charts
On the bar chart, the step names display beneath the X-axis. You can use bar charts to
display sensor information where each bar with a distinct color represents a parameter for a
step. The X-axis displays the step names.
Behaviors Common to Both Chart Types
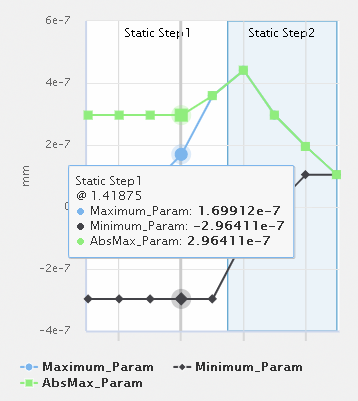
You can obtain local result values directly by probing the bar chart or X-Y plot. Moving the mouse over a bar or clicking the bar updates the values displayed in the legend area. Moving the mouse over an X-Y plot draws a vertical line through the common x-axis value for all curves at the position of the cursor. Physics Simulation Review highlights the corresponding y-axis coordinate and updates the values displayed in the legend:
In addition, clicking the X-Y plot navigates to the animation frame corresponding to the position of the cursor. You can move the cursor across the plot to drive the animation.
When the experience content contains many steps or load cases, the side panel might not be wide enough to accommodate their labels. In this case, the names are hidden, and a tooltip appears when you hover over the bar for a given step.
You can use the legend lock to limit the plot view to a specific step or load case. For more information, see Limiting the Plot View to a Specific Step or Load Case.