About Sensor Information | ||||
|
| |||
Sensor Types
There are three types of sensors. They are defined by how the values are distributed over the simulation steps, frames, and load cases:
| Sensor Output Type | Description | Details of display (side panel) |
|---|---|---|
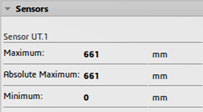
| Type I Sensors (Global) | One value over all steps, frames, load cases. | No chart; the minima/maxima and units are displayed in the side panel. |
| Type II Sensors (Values by Step or Load Case) | One value per step. These field sensors were created in Physics Results Explorer using the Create parameters for each selected step option. |
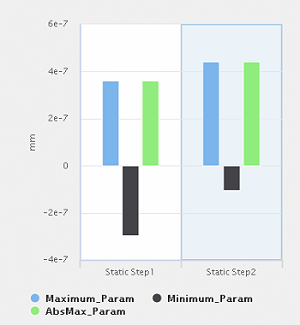
Sensor information is displayed in a bar chart, where each bar represents a parameter for a step. |
| Type III Sensors (Values by Frame or Load Case) | One value per step. These field sensors were created in Physics Results Explorer using the Create parameters for each selected loadcase/frame option. |
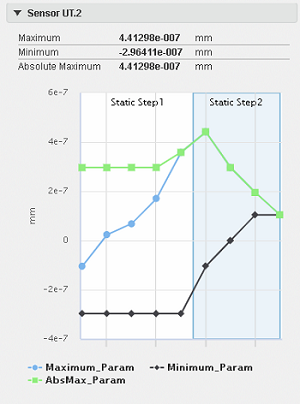
Sensor information is displayed in an X-Y plot where each sensor has its own curve to display all its value across all the steps. |
Type I Sensors (Global)
Type I sensors (global) are displayed in the side panel with a name based on the variable, a value, and a unit; for example, Sensor UT.1 (U) Maximum: 661 mm:

Type II Sensors (Values by Step or Load Case)
Type II sensors (values by step or load case) are displayed in the side panel as a bar chart
where each bar represents a parameter for a step. 
Each sensor parameter is displayed for each step as a single bar with a distinct color. For example, the Maximum parameter displays a bar of a different color than does the Minimum parameter. The X-axis displays the name of the steps. If the sensor data originates from plots and steps other than the current 3D display, those bars are displayed in gray. For example, you can include sensor data from harmonic response load cases for displacement plots with a modal dynamic step. In that scenario, no current value is displayed in the plot legend, but probing is still enabled.
When the experience content contains many steps or load cases, the side panel might not be wide enough to accommodate their labels. In this case, the names are hidden, and a tooltip appears when hovering over the bar for a given step.
Type III Sensors (Values by Frame or Load Case)
Type III sensors (values by frame or load case) are displayed in the side panel in an X-Y plot.
Each sensor has its own curve to display values across all steps. 
Each sensor parameter is displayed as a curve defined by X- and Y-values. The X-axis displays the name of the steps directly in the chart area. Below the plot, the legend displays the sensor value for the current frame followed by the frame position (time or frequency).
When the experience content contains many steps or load cases, the side panel might not be wide enough to accommodate their labels. In this case, the names are hidden, and a tooltip appears when hovering over a given step.