Identifying Extrema | ||||
|
| |||
-
Click Show/Hide Min/Max
 from the
action bar.
from the
action bar.
The extrema are hidden by default.
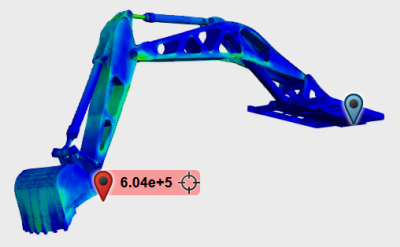
A single global minimum and global maximum marker appears on the model. -
Click the minimum
 or maximum
 marker to display the extrema values of the plot.
- A small white dot is added to the model below the minimum and maximum markers to pinpoint the exact location of the extrema value, which is helpful when the extrema are hidden by a surface.
- The minimum and maximum marker visibility is affected by Hide/Show
 . If the
part of the simulation that contains the global minimum or global
maximum is hidden, a new local minimum
. If the
part of the simulation that contains the global minimum or global
maximum is hidden, a new local minimum  or maximum
  appears for the visible parts. If the global
minimum or global maximum occurs over many parts, hiding one part does
not result in the use of the dotted icon.
appears for the visible parts. If the global
minimum or global maximum occurs over many parts, hiding one part does
not result in the use of the dotted icon.
-
Click the extrema marker again to display the value in the marker
label.
-
Click
Reframe
 on the marker label to reorient the model normal to the
minimum or maximum.
on the marker label to reorient the model normal to the
minimum or maximum.
-
Click
Restore
 to go back to the previous view.