Modifying the Range of Results Displayed | |||||
|
| ||||
 to restore it.
-
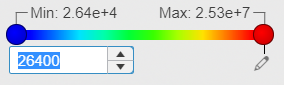
To modify the ranges displayed in the legend and associated plot,
click the minimum or maximum value in the legend, and enter a new value
directly or use the increment arrows.
As you assign new extrema, the spectrum of the 3D plot changes and the legend updates to show the new minimum or maximum.
Legend Display Description 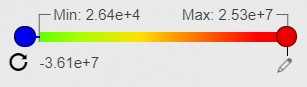
The user minimum is less than the computed minimum. A blue offset marker is attached to the left side of the color bar. The blue offset marker is fixed in position regardless of the actual difference between the computed and user-defined value.
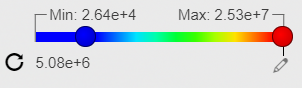
The user minimum is greater than the computed minimum. A blue offset marker is attached to the left side of the color bar. The blue marker indicates the position of the user-defined minimum in the modified range.

The user maximum is greater than the computed maximum. A red offset marker is attached to the right side of the color bar. The red offset marker is fixed in position regardless of the actual difference between the computed and user-defined value.
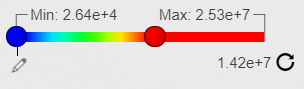
The user maximum is less than the computed maximum. A red offset marker is attached to the right side of the color bar. The red marker indicates the position of the user-defined maximum in the modified range.
Combinations of the above scenarios can occur, as well. For example, both extrema markers might be in the range, both out of the range, or one in range and one out of range.
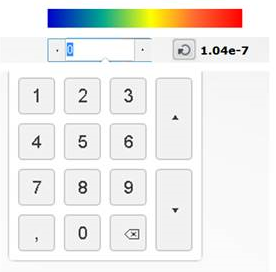
Note: When the global range is zero (global maximum = global minimum), the user-defined minimum and maximum are not displayed in the legend and the legend cannot be edited.On touch screens, the increment and decrement buttons are on the left and right sides of the edit field. When you touch the edit field, a dedicated keypad displays with its own increment and decrement buttons as the following figure shows:
Note: The user-defined minimum and maximum are defined across all load cases, steps, modes, and frames. If you change one of these values and then switch to another step, the user-defined minimum and maximum are retained. -
Click
 to return the new minimum or maximum to its previously
calculated value.
to return the new minimum or maximum to its previously
calculated value.