- From the Wireframe section of the action bar, click Sketch from Scan
 . .
-
Select nonplanar scans, or meshes (to process their free edges), geometrical sets,
multi-outputs, and selections sets.
The elements selected are highlighted and split points are
proposed with their associated constraints (below, shown by the green callout, with a
tangent symbol). 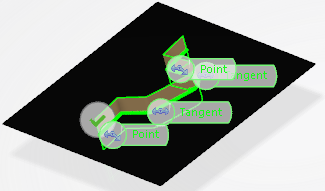
- Those split points are not necessarily the endpoints of the primitives created.
- Fixed split points are not proposed for closed scans, thus reducing the number of
primitives created and improving the output.
- Fixed points are proposed as end points of open scans.
- To impose constraints on the scans used to create the sketch. select the Display
option Constraint.
- Manage split points manually:
- Move them using the Ctrl key.
- Pick a point of the scan to add a split point.
- Right-click a point to remove one or all points.
-
Right-click a point and select Impose tangency to specify a
tangency constraint.
-
Deselect Impose tangency to specify a passage (Point)
constraint.
- Or manage split points automatically.
- Select the Threshold check box and define its value.
The
threshold acts like a sag value. The scan is cut into segments, according to the threshold value.
The endpoints of those segments are potential split points. Only the endpoints of the scans are proposed as fixed split points.
- Optional: Change the Tolerance (deviation between the output elements and the points of the scan).
- Click Apply.
The sketch is computed. - If the sketch is not complete,
create additional split points by picking points on the
scan.
- Click
Apply
The sketch is now fully computed.
- Click More to display the global statistics in
the dialog box.
You can find: - The number of recognized elements
- The maximum deviation
- The mean deviation
- The percentage of points under the tolerance.
-
To
create primitives, specify Display as
Primitive.
An automatic recognition is proposed.
- Optional: Right-click a segment and select another computation option.
- Automatic:
The best primitive is computed.
- Nothing:
Nothing is computed.
- Line, Circle,
Ellipse: The best line, circle, or ellipse is computed.
- Click
 to display local deviations results (maximum and mean deviations).
 The maximum and mean deviations, as well as the percentage of
points under the required tolerance, are displayed in the work area for each segment of
points. - These statistics are displayed in green if the maximum deviation
is lower than the tolerance.
- They are displayed in red otherwise.
- The percentage of points under the required tolerance is displayed only if the maximum deviation
is higher than the tolerance (otherwise, the percentage is equal to 100% and its
display is not relevant).
|