This section provides you with information to create stacked-bar
charts.
StackedBar
The table expects two or more columns with numbers.
| SerieALabel |
SerieBLabel |
SerieCLabel |
| ValueA1 |
ValueB1 |
ValueC1 |
| ValueA2 |
ValueB2 |
ValueC2 |
Note:
A, B, and C are different series. You can give as many series as you want
from 1 to N.
StackedBarWithLabel
| Title |
SerieALabel |
SerieBLabel |
SerieCLabel |
| Label1 |
ValueA1 |
ValueB1 |
ValueC1 |
| Label2 |
ValueA2 |
ValueB2 |
ValueC2 |
The table expects two or more columns with labels in the first columns and numbers in other
columns.
Notes:
The Title element is not relevant.
A, B, and C are different series. You can give as many series as you want from 1 to
N.
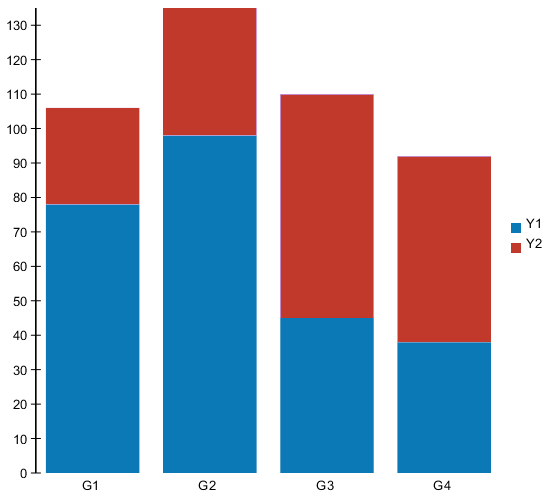
Example
For the following values:
| Label |
Y1 |
Y2 |
| G1 |
78 |
28 |
| G2 |
98 |
37 |
| G3 |
45 |
65 |
| G4 |
38 |
54 |
The corresponding graph is inserted in the report: