-
To define this example of a report template for behavior experience data:
-
From the
 Properties tab, in the Parameters area,
click New.
-
From the Type list, select System Behavior
Simulation.
-
To display and access the model name:
-
From the
 Structures tab, drag Paragraph into the
graphical area.
-
From the
 Data tab, expand the following variable and category, and then
drag the method to the graphical area:
 Variable and
Types Variable and
Types |
 Category Category |
 Method Method |
Graphical Area |
|
Simulation Data |
Model |
Paragraph |
-
To access the simulation data in general:
-
From the
 Data tab, expand the following variable and category.
-
Drag the method to the graphical area:
 Variable and
Types Variable and
Types |
 Category Category |
 Method Method |
Graphical Area |
|
Simulation Data |
Scenarios |
Empty space (below the paragraph) |
-
To present and access the scenario names:
-
From the
 Structures tab:
- Drag Section into the Loop of Scenarios of p:
sce.
- Drag Text into the section title.
-
Click the text element, and enter Scenario: in the
Text box of the Properties tab.
-
From the
 Data tab, expand the following variable and category, and then
drag the method to the graphical area:
 Variable and
Types Variable and
Types |
 Category Category |
 Method Method |
Graphical Area |
|
Simulation Data |
Name |
Section title, after Scenario: |
-
To present and access the scenario comments:
-
From the
 Structures tab, drag Paragraph into the
section.
-
From the
 Data tab, expand the following variable and category, and then
drag the method to the graphical area:
 Variable and
Types Variable and
Types |
 Category Category |
 Method Method |
Graphical Area |
|
Simulation Data |
Comment |
Section, in the paragraph |
-
To present and access the scenario parameter names and values:
These parameters are the start time and the stop time of the scenario.
-
From the
 Structures tab:
- Drag Table into the section.
- Drag Row into the table, under the header row.
- Into the first cell in the header row, drag Text, click
it, and enter Name.
- Into the second cell in the header row, drag Text, click
it, and enter Value.
-
From the
 Data tab, expand the following variable and category, and then
drag the method to the graphical area:
 Variable and
Types Variable and
Types |
 Category Category |
Method |
Graphical Area |
|
Simulation Data |
 Parameters
 |
Table, between the header row and the row.
|
|
Simulation Data |
 Name
Name |
The first cell of the table row in Loop on Parameters of sce:
sce2 |
|
Simulation Data |
 Value
Value |
The second cell of the table row in Loop on Parameters of sce:
sce2 |
-
To display a header for the simulation results:
-
From the
 Structures tab:
- Drag Paragraph into Loop on Scenarios of p:
sce, at the end of this loop.
- Drag Text into the paragraph, click it, and enter
Results.
-
From the
 Data tab, expand the following variable and category, and
then drag the method to the graphical area: Data tab, expand the following variable and category, and
then drag the method to the graphical area:
 Variable and
Types Variable and
Types |
 Category Category |
 Method Method |
Graphical Area |
|
Simulation Data |
Results |
Loop on Scenarios of p: sce; after existing
items |
-
To display the name of the results, and to access plots and probes:
-
From the
 Structures tab, drag Paragraph into
Loop on Results on sce: res.
-
From the
 Data tab, expand the following variables and categories,
and then drag the methods to the graphical area: Data tab, expand the following variables and categories,
and then drag the methods to the graphical area:
 Variable and
Type Variable and
Type |
 Category Category |
 Method Method |
Graphical Area |
|
Simulation Data |
 Name
Name |
The paragraph in Loop on Results of sce: res |
|
Simulation Data |
 Plots
Plots |
Loop on Results of sce: res, after the
paragraph |
|
Simulation Data |
 Probe Results
 |
Loop on Results of sce: res, after the
Loop on Plots of res: plo |
-
To manage the display of the plots data:
Plots data include both live plots and plots from watchlists.
-
From the
 Structures tab: Structures tab:
- Drag List into Loop on Plots of res:
plo.
- Drag Paragraph below the inserted list item.
-
From the
 Data tab, expand the following variables and categories,
and then drag the methods to the graphical area: Data tab, expand the following variables and categories,
and then drag the methods to the graphical area:
 Variable and
Types Variable and
Types |
 Category Category |
 Method Method |
Graphical Area |
|
Simulation Data |
Plot Name |
First paragraph in the list item inserted in Loop on Plots of
res: plo |
|
Simulation Data |
Plot Image |
Second paragraph in the list item inserted in Loop on Plots of
res: plo |
-
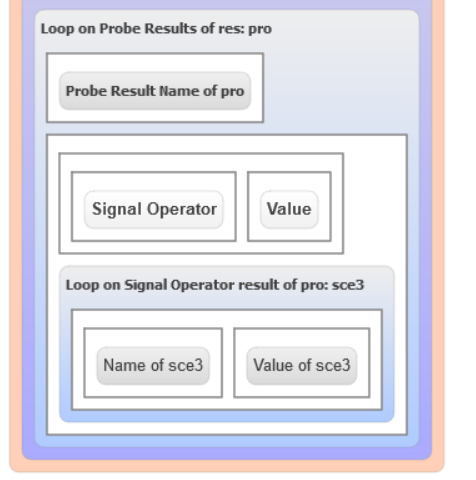
To present and access the probe results:
-
From the
 Structure tab:
- Drag Paragraph into the Loop on Probe Results
on res: pro.
- Drag Table into the Loop on Probe Results on
res: pro, after the paragraph.
- Drag Row into the table.
- Into the first cell in the header row of the table, drag
Text, click it, and enter Signal
Operator.
- Into the second cell in the header row of the table, drag
Text, click it, and enter
Value.
-
From the
 Data tab, expand the following variable and category, and drag
the method to the graphical area:
 Variable and
Types Variable and
Types |
 Category Category |
Method |
Graphical Area |
|
Simulation Data |
 Probe Result Name
 |
Paragraph in Loop on Probe Results of res:
pro |
|
Simulation Data |
 Signal Operator Result
 |
Table, between the header row and the row.
|
|
Simulation Data |
 Name
Name |
The first cell of the table row in Loop on Signal Operator
result of pro: sce3 |
|
Simulation Data |
 Value
Value |
The second cell of the table row in Loop on Signal Operator
result of pro: sce3 |
Notes:
- Due to the size of the report template, the image of it is divided in three
images.
- The method Loop on Scenarios of p: sce is selected to better
see the levels in the images.
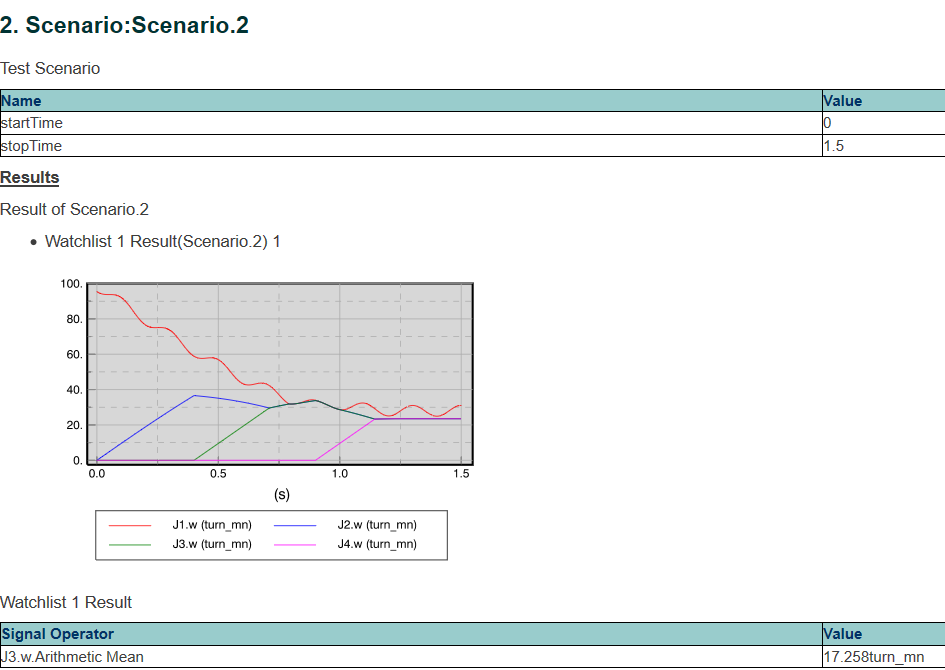
When you preview the report template, a part of it may look like:

|


