Problem description
Adiabatic temperature is a convenient scalar variable for this type of test because its spatial distribution can be held constant over a step and it is remapped when adaptive meshing is used. The rotating flow field is generated by either holding the mesh fixed while rotating the material or holding the material fixed while rotating the mesh.
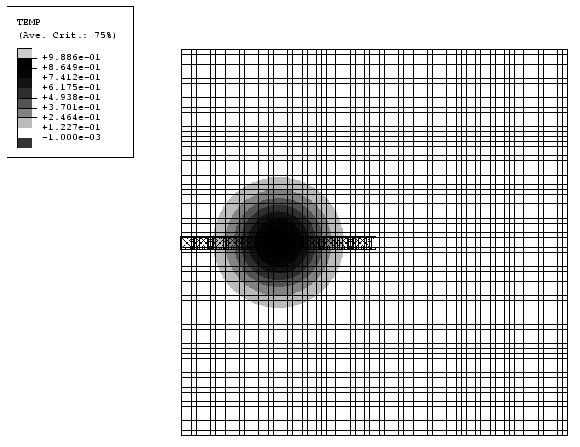
The finite element model consists of a two-dimensional domain with dimensions 2.0 × 2.0 meshed with CPS4R elements. The mesh density is 80 × 80, and the origin is located at the center of the square domain. The initial configuration is shown in Figure 1 with contours of initial temperature on the mesh. The initial temperature distribution, , is a function of the coordinates and is given as
where .
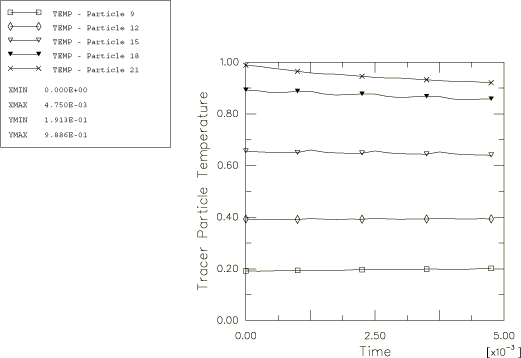
As shown in the figure, the temperature distribution has a peak value of 1.0 that occurs along the x-axis at −0.5. The temperature tends to zero as the distance from the peak increases. The temperature in the first and fourth quadrants of the model and along all the edges is less than 0.01. Tracer particles are defined to monitor the material motion and temperature throughout the analysis. As shown in Figure 1, the tracer particles are located initially along the negative x-axis.
An adiabatic procedure is used, and the material is modeled as von Mises elastic-plastic. The Young's modulus and yield strength are chosen so that the material undergoes very little deformation and stays in the elastic regime; therefore, the temperature field remains unchanged from its initial condition.
A rotating flow field is generated using one of the following two techniques:
-
The mesh is held fixed, and the material is given a rotation about the origin. The material is assumed to extend beyond the boundaries of the finite element mesh. All the elements are included in a single adaptive mesh domain, and an Eulerian boundary is defined along the entire perimeter of the model. The mesh is held fixed spatially by applying adaptive mesh constraints at the nodes along the Eulerian boundary and also by performing adaptive meshing based on the position of nodes at the end of the previous adaptive mesh increment, which has the effect of holding the mesh stationary for a uniform mesh with no overall deformation.
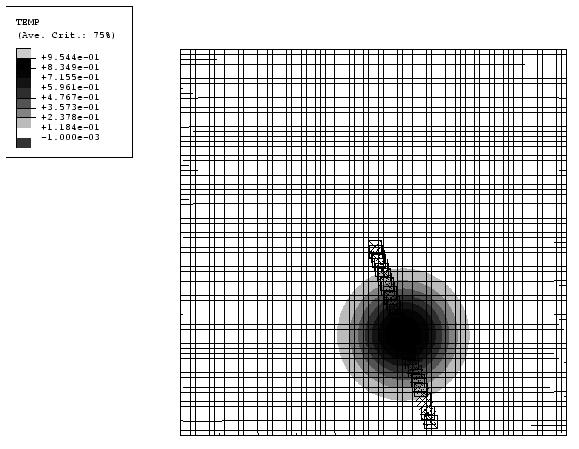
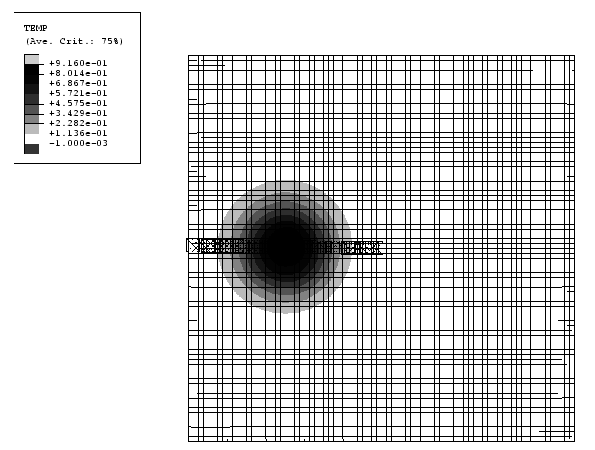
An initial rotational velocity of 1256.64 rad/sec about the origin is specified for all nodes, so that the material rotates a full 360° in 0.005 s. The geometry and problem definition should result in conservation of angular momentum, even though material flows into and out of the domain through the Eulerian boundary. The rotary inertia of the system is based only on the mass distribution within the model boundaries (not on material outside the Eulerian boundaries), which remains constant throughout the analysis. Thus, with proper advection, the angular velocity should also remain constant throughout the analysis.
-
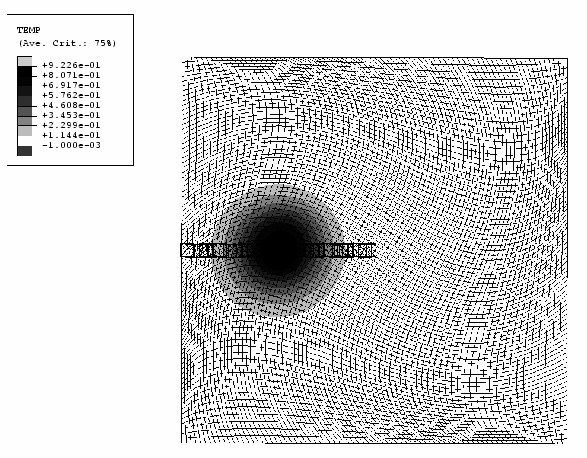
The material is fixed, and the mesh is given a rotation about the origin. As in Case 1, the material is assumed to extend beyond the boundaries of the mesh. All elements are included in a single adaptive mesh domain, and an Eulerian boundary is defined along the entire perimeter of the model. For this case the mesh domain is rotated by applying an adaptive mesh constraint at nodes along the Eulerian boundary. The motion of each node along the boundary is prescribed by defining a separate amplitude curve. Adaptive meshing is performed every 10 increments, and the number of mesh sweeps per increment is 5. With these settings nodes on the interior of the mesh follow the rotation only approximately, lagging slightly behind. The lagging of the mesh can be minimized by increasing the number of mesh sweeps or lowering the frequency value. However, lagging is intentionally allowed here as a verification of the advection algorithms for a geometrically complex mesh pattern.
