Problem description
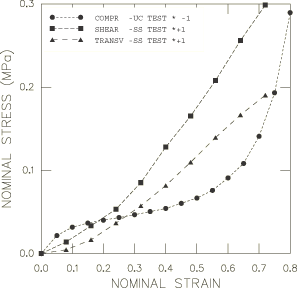
For this example the test data are composed of uniaxial compression and simple shear data whose nominal stress–nominal strain curves are shown in Figure 1. The uniaxial compression curve (labeled “1” in the figure) can be broken down into three stages:
At small strains ( 5%) the foam deforms in a linear, elastic way due to cell wall bending.
This is followed by a plateau of deformation with a relatively small range of stress caused by the elastic buckling of the cell walls.
At higher strains a region of densification occurs where the cell walls crush together resulting in a rapid increase of compressive stress.
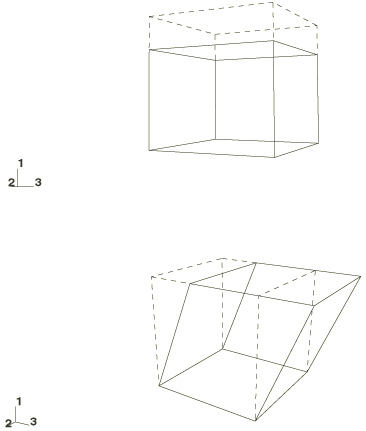
For this material the effective Poisson's ratio is zero, which is evident by the absence of lateral displacements, as seen in Figure 2 in which a single continuum element illustrates the two deformation modes: uniaxial compression and simple shear.
The simple shear deformation results in a combination of compression and tension of the cell walls. In addition to the shear stress (labeled “2” in Figure 1), a transverse tensile stress (labeled “3” in the figure) is developed normal to the shear direction—this is called the Poynting effect. This transverse stress is included in the test data in addition to the shear stress.


