Direct cyclic analysis of a cylinder head under cyclic thermomechanical
loadings
This example demonstrates the use of the direct cyclic analysis
procedure to obtain results that can be used for fatigue life calculations,
which are fundamental in assessing product performance.
It is well known that a highly loaded structure, such as a cylinder head in
an engine subjected to large temperature fluctuations and clamping loads, can
undergo plastic deformations. After a number of repetitive loading cycles there
will be one of three possibilities: elastic shakedown, in which case there is
no danger of low-cycle fatigue; plastic shakedown, leading to a stabilized
plastic strain cycle, in which case energy dissipation criteria will be used to
estimate the number of cycles to failure; and plastic ratchetting, in which
case the design is rejected. The classical approach to obtaining the response
of such a structure is to apply the periodic loading repetitively to the
structure until a stabilized state is obtained or plastic ratchetting occurs.
This approach can be quite expensive, since it may require application of many
loading cycles to obtain the steady response. To avoid the considerable
numerical expense associated with such a transient analysis, the direct cyclic
analysis procedure, described in
Direct Cyclic Analysis,
can be used to calculate the cyclic response of the structure directly.
Geometry and model
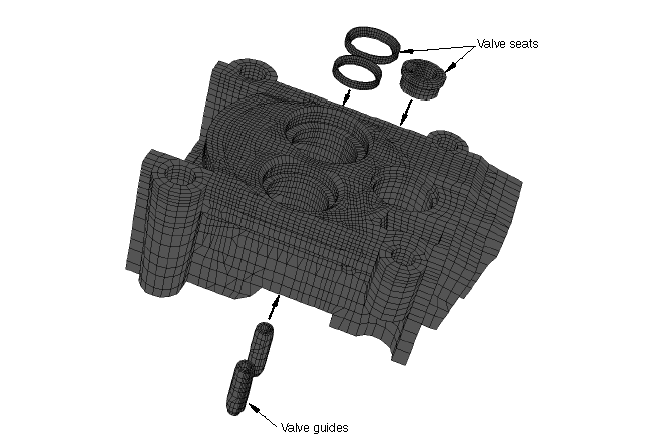
The cylinder head analyzed in this example is depicted in
Figure 1.
The cylinder head (which is a single cylinder) has three valve ports, each with
an embedded valve seat; two valve guides; and four bolt holes used to secure
the cylinder head to the engine block.
The body of the cylinder head is made from aluminum with a Young's modulus
of 70 GPa, a yield stress of 62 MPa, a Poisson's ratio of 0.33, and a
coefficient of thermal expansion of 22.6 × 10⁻⁶ per °C at room
temperature. In this example the region in the vicinity of the valve ports,
where the hot exhaust gases converge, is subjected to cyclic temperature
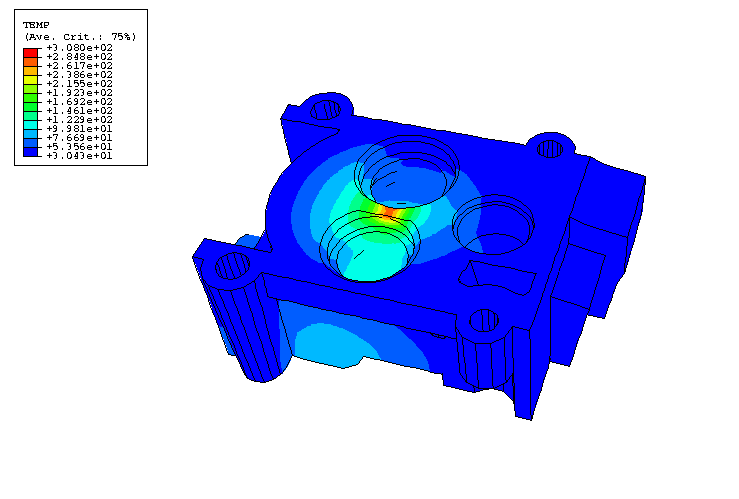
fluctuations ranging from a minimum value of 35°C to a maximum value of 300°C.
The temperature distribution when the cylinder head is heated to its peak value
is shown in
Figure 2.
Under such operating conditions plastic deformation, as well as creep
deformation, is observed. The two-layer viscoelastic-elastoplastic model, which
is best suited for modeling the response of materials with significant
time-dependent behavior as well as plasticity at elevated temperatures, is used
to model the aluminum cylinder head (see
Two-Layer Viscoplasticity).
This material model consists of an elastic-plastic network that is in parallel
with an elastic-viscous network. The Mises metal plasticity model with
kinematic hardening is used in the elastic-plastic network, and the power-law
creep model with strain hardening is used in the elastic-viscous network. Since
the elastic-viscoplastic response of aluminum varies greatly over this range of
temperatures, temperature-dependent material properties are specified.
The two valve guides are made of steel, with a Young's modulus of 106 GPa
and a Poisson's ratio of 0.35. The valve guides fit tightly into two of the
cylinder head valve ports and are assumed to behave elastically. The interface
between the two components is modeled by using matched meshes that share nodes
along the interface.
The three valve seats are made of steel, with a Young's modulus of 200 GPa
and a Poisson's ratio of 0.3. The valve seats are press-fit into the cylinder
head valve ports. This is accomplished by defining radial constraint equations
of the form
between the nodes on the valve seat surface and the nodes on the valve port
surface, where
is the radial displacement on the valve port,
is the radial displacement on the valve seat, and
is a reference node. During the first step of the analysis a prescribed
displacement is applied to the reference node, resulting in normal pressures
developing between the two components. The valve seats are assumed to behave
elastically.
All of the structural components (the cylinder head, the valve guides, and
the valve seats) are modeled with three-dimensional continuum elements. The
model consists of 19394 first-order brick elements (C3D8) and 1334 first-order prism elements (C3D6), resulting in a total of about 80,000 degrees of freedom. The C3D6 elements are used only where the complex geometry precludes the
use of C3D8 elements.
Loading and boundary constraints
The loads are applied to the assembly in two analysis steps. In the first
step the three valve seats are press-fit into the corresponding cylinder head
valve port using linear multi-point equation constraints and prescribed
displacement loadings as described above. A static analysis procedure is used
for this purpose. The cyclic thermal loads are applied in the second analysis
step. It is assumed that the cylinder head is securely fixed to the engine
block through the four bolt holes, so the nodes along the base of the four bolt
holes are secured in all directions during the entire simulation.
For an engine cylinder head, the valve seat press-fit occurs in the engine
assembly process and the cyclic thermal loading occurs under engine operating
conditions. Taking this into consideration, you can request the long-term
response for two-layer viscoplasticity in the static analysis procedure. The
choice of the instantaneous or long-term elastic solution affects only the
results of the first static step, but the effect on the direct cyclic
thermomechanical analysis is negligible.
The cyclic thermal loads are obtained by performing an independent thermal
analysis. In this analysis three thermal cycles are applied to obtain a
steady-state thermal cycle. Each thermal cycle involves two steps: heating the
cylinder head to the maximum operating temperature and cooling it to the
minimum operating temperature using concentrated flux and film conditions. The
nodal temperatures for the last two steps (one thermal cycle) are assumed to be
a steady-state solution and are stored in a results (.fil)
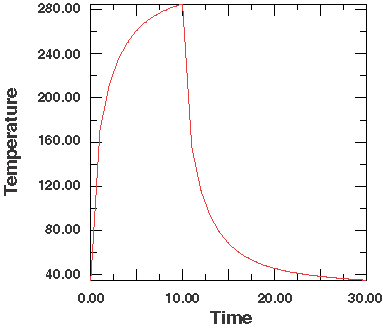
file for use in the subsequent thermomechanical analysis. The maximum value of
the temperature occurs in the vicinity of the valve ports where the hot exhaust
gases converge. The temperature in this region (node 50417) is shown in
Figure 3
as a function of time for a steady-state cycle.
In the second step of the mechanical analysis cyclic nodal temperatures
generated from the previous heat transfer analysis are applied. The direct
cyclic procedure with a fixed time incrementation of 0.25 and a load cycle
period of 30 is specified in this step, resulting in a total number of 120
increments for one iteration. The number of terms in the Fourier series and the
maximum number of iterations are 40 and 100, respectively.
For comparison purposes the same model is also analyzed using the classical
transient analysis, which requires 20 repetitive steps before the solution is
stabilized. A cyclic temperature loading with a constant time incrementation of
0.25 and a load cycle period of 30 is applied in each step.
Results and discussion
One of the considerations in the design of a cylinder head is the stress distribution and
deformation in the vicinity of the valve ports. Figure 4 shows the von Mises stress distribution in the cylinder head at the end of a loading
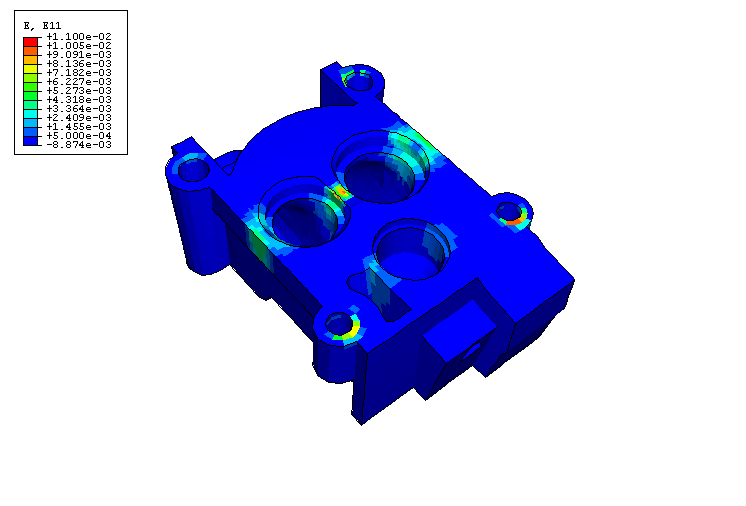
cycle (iteration 75, increment 120) in the direct cyclic analysis. The total strain
distribution at the same time in the direct cyclic analysis is shown in Figure 5. The deformation and stress are most severe in the vicinity of the valve ports, making
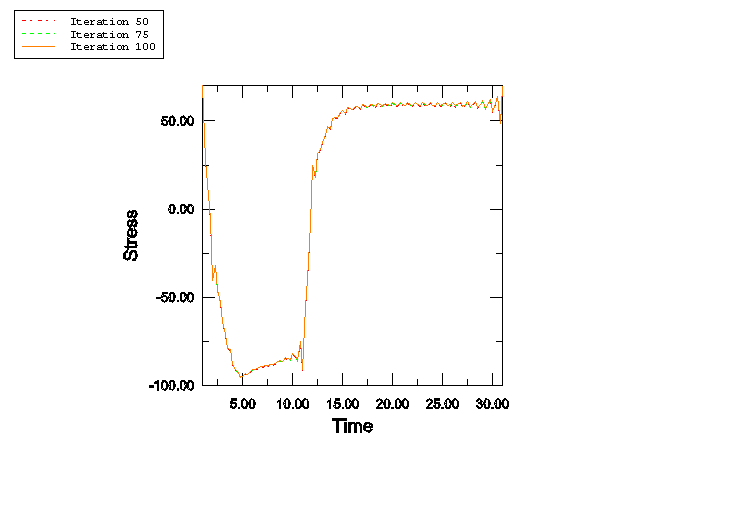
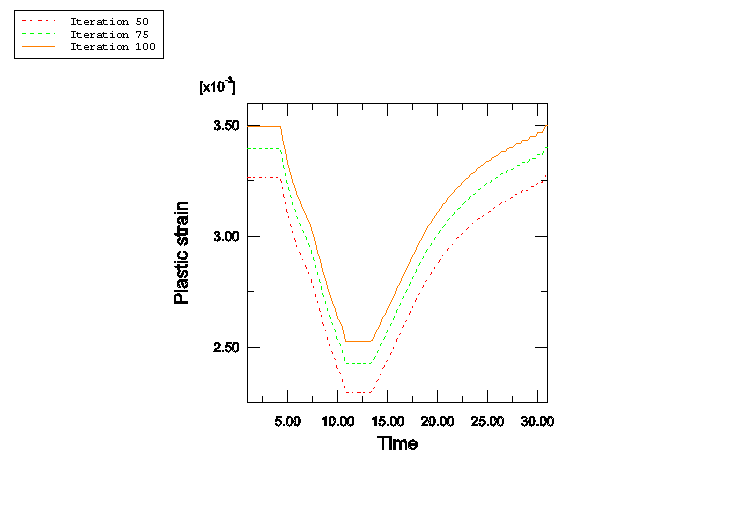
this region critical in the design. The results shown in Figure 6 through Figure 16 are measured in this region (element 50152, integration point 1). Figure 6, Figure 7, and Figure 8 show the evolution of the stress component, plastic strain component, and viscous strain
component, respectively, in the global 1-direction throughout a complete load cycle during
iterations 50, 75, and 100 in the direct cyclic analysis. The time evolution of the stress
versus the plastic strain, shown in Figure 9, is obtained by combining Figure 6 with Figure 7. Similarly, the time evolution of the stress versus the viscous strain, shown in Figure 10, is obtained by combining Figure 6 with Figure 8. The shapes of the stress-strain curves remain unchanged after iteration 75, as do the
peak and mean values of the stress over a cycle. However, the mean value of the plastic
strain and the mean value of the viscous strain over a cycle continue to grow from one
iteration to another iteration, indicating that the plastic ratchetting occurs in the
vicinity of the valve ports.
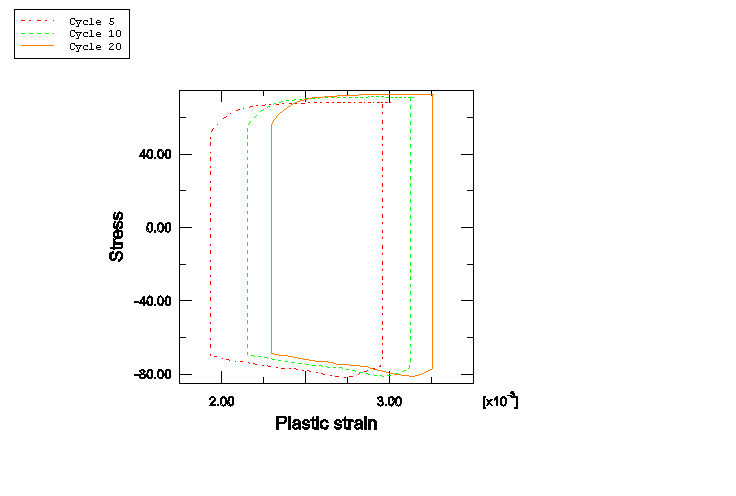
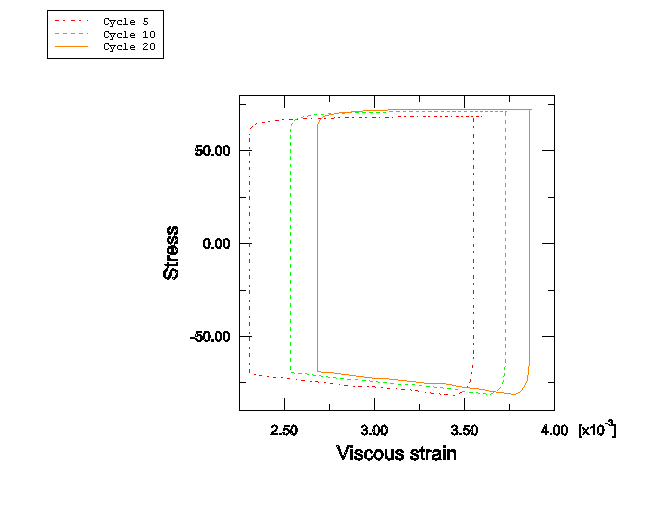
Similar results for the evolution of stress versus plastic strain and the
evolution of stress versus viscous strain during cycles 5, 10, and 20 obtained
using the classical transient approach are shown in
Figure 11
and
Figure 12,
respectively. The plastic ratchetting is observed to be consistent with that
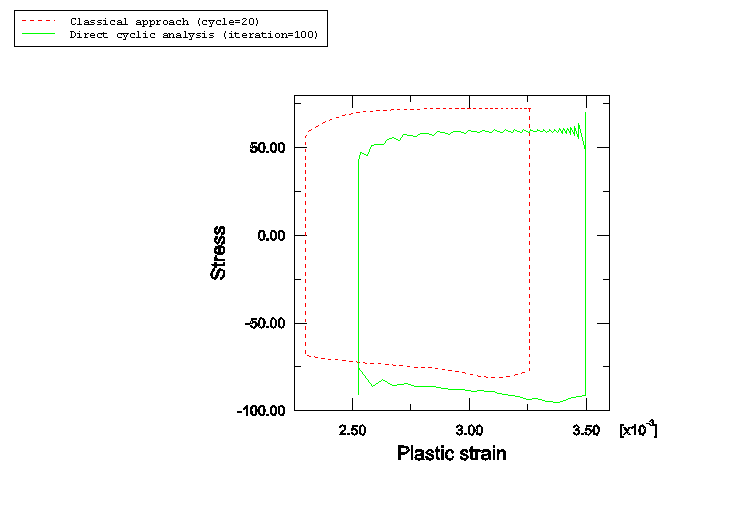
predicted using the direct cyclic approach. A comparison of the evolution of
stress versus plastic strain obtained during iteration 100 in the direct cyclic
analysis with that obtained during cycle 20 in the transient approach is shown
in
Figure 13.
A similar comparison of the evolution of stress versus viscous strain obtained
using both approaches is shown in
Figure 14.
The shapes of the stress-strain curves are similar in both cases.
One advantage of using the direct cyclic procedure, in which the global
stiffness matrix is inverted only once, instead of the classical approach in
Abaqus/Standard
is the cost savings achieved. In this example the total computational time
leading to the first occurrence of plastic ratchetting in the direct cyclic
analysis (75 iterations) is approximately 70% of the computational time spent
in the transient analysis (20 steps). The savings will be more significant as
the problem size increases.
Additional cost savings for the solution can often be obtained by using a
smaller number of terms in the Fourier series and/or a smaller number of
increments in an iteration. In this example, if 20 rather than 40 Fourier terms
are chosen, the total computational time leading to the first occurrence of
plastic ratchetting in the direct cyclic analysis (75 iterations) is
approximately 65% of the computational time spent in the transient analysis (20
steps). Furthermore, if a fixed time incrementation of 0.735 rather than 0.25
is specified, leading to a total number of 41 increments for one iteration, the
total computational time in the direct cyclic analysis is reduced by a factor
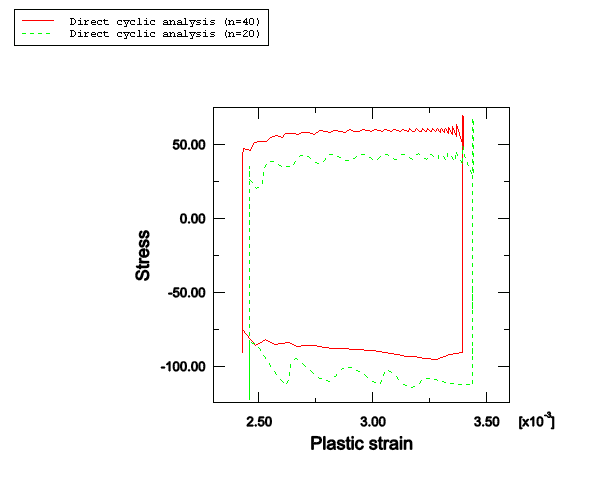
of three without compromising the accuracy of the results. A comparison of the
evolution of stress versus plastic strain obtained using fewer Fourier terms
during iteration 75 is shown in
Figure 15.
A similar comparison of the evolution of stress versus viscous strain obtained
using fewer Fourier terms is shown in
Figure 16.
The shapes of the stress-strain curves and the amount of energy dissipated
during the cycle are similar in both cases, although the case with fewer
Fourier terms provides less accurate stress results.
Another advantage of using the direct cyclic approach instead of the
classical approach is that the likelihood of plastic ratchetting or stabilized
cyclic response can be predicted automatically by comparing the displacement
and residual coefficients with some internal control variables. There is no
need to visualize the detailed results for the whole model throughout the
loading history, which leads to a further reduction of the data storage and
computational time associated with output. For this example examination of the
displacement and the residual coefficients written to the message
(.msg) file makes it clear that the constant term in the
Fourier series does not stabilize and, thus, plastic ratchetting occurs.
Acknowledgements
SIMULIA
gratefully acknowledges PSA Peugeot Citroën
and the Laboratory of Solid Mechanics of the Ecole Polytechnique (France) for
their cooperation in developing the direct cyclic analysis capability and for
supplying the geometry and material properties used in this
example.
Maitournam, H., B. Pommier, and J. J. Thomas, “Détermination
de la réponse asymptotique d'une structure anélastique sous chargement
thermomécanique cyclique,” C. R.
Mécanique, vol. 330, pp. 703–708, 2002.
Maouche, N., H. Maitournam, and K. Dang
Van, “On
a new method of evaluation of the inelastic state due to moving
contacts,” Wear, pp. 139–147, 1997.
Nguyen-Tajan, T.M.L., B. Pommier, H. Maitournam, M. Houari, L. Verger, Z. Z. Du, and M. Snyman, “Determination
of the stabilized response of a structure undergoing cyclic thermomechanical
loads by a direct cyclic method,” Abaqus
Users' Conference
Proceedings, 2003.
Figures
Figure 1. A cylinder head model. Figure 2. Temperature distribution when the cylinder head is heated to its peak
value. Figure 3. Temperature at node 50417 as a function of time for a steady-state
cycle. Figure 4. Von Mises stress distribution in the cylinder head at the end of a loading cycle (iteration
75, increment 120) in the direct cyclic analysis. Figure 5. Total strain distribution in the cylinder head at the end of a loading
cycle (iteration 75, increment 120) in the direct cyclic analysis. Figure 6. Evolution of the stress component in the global 1-direction during
iterations 50, 75, and 100 in the direct cyclic analysis. Figure 7. Evolution of the plastic strain component in the global 1-direction
during iterations 50, 75, and 100 in the direct cyclic analysis. Figure 8. Evolution of the viscous strain component in the global 1-direction
during iterations 50, 75, and 100 in the direct cyclic analysis. Figure 9. Evolution of the stress versus plastic strain during iterations 50,
75, and 100 in the direct cyclic analysis. Figure 10. Evolution of the stress versus viscous strain during iterations 50,
75, and 100 in the direct cyclic analysis. Figure 11. Evolution of the stress versus plastic strain during steps 5, 10, and
20 in the transient analysis. Figure 12. Evolution of the stress versus viscous strain during steps 5, 10, and
20 in the transient analysis. Figure 13. Comparison of the evolution of stress versus plastic strain obtained
with the direct cyclic analysis and transient analysis approaches. Figure 14. Comparison of the evolution of stress versus viscous strain obtained
with the direct cyclic analysis and transient analysis approaches. Figure 15. Comparison of the evolution of stress versus plastic strain obtained
using different numbers of Fourier terms during iteration 75 in a direct cyclic
analysis. Figure 16. Comparison of the evolution of stress versus viscous strain obtained
using different numbers of Fourier terms during iteration 75 in a direct cyclic
analysis.