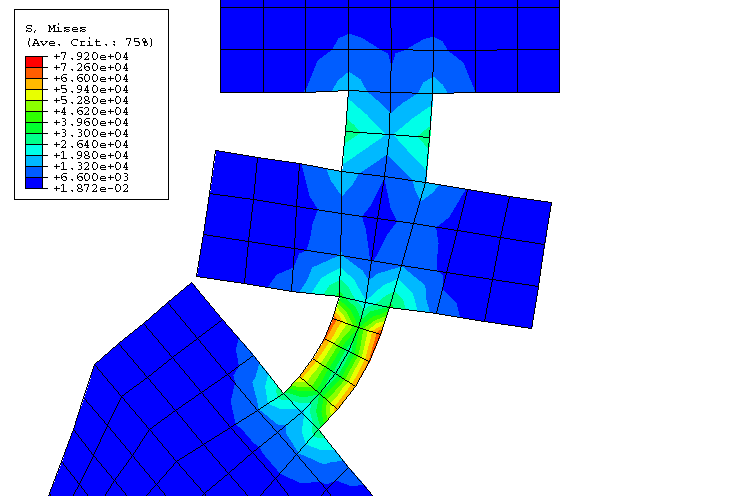
A contour plot of the von Mises stress distribution on the deformed configuration of the rubber
blade is shown in Figure 5. It
is evident that the two necks between the flanges are the areas of interest. In a magnified
contour plot of the von Mises stress distribution in the necks (Figure 6)
we can see that the stress concentration in the lower neck is higher than in the upper one.
The normalized sensitivities of the maximum von Mises stresses in the lower neck are listed
in Table 1. Sensitivities are normalized by dividing them by the maximum Mises value (67857.7 units
in element 131 of the wiper blade) and then scaling the result by the initial value of the
design parameter. We notice that the shape parameters have a direct effect (increasing the
parameter increases stress and vice versa) and the friction coefficient has an inverse
effect on the von Mises stress. Reducing the thickness of the neck makes the wiper more
flexible and reduces stress concentration. Increasing the friction coefficient increases the
shear force at the tip. This increased shear force increases bending of the upper neck and
decreases bending in the lower neck, thus reducing the stress concentration in the lower
neck. We infer from the table that the von Mises stress is more sensitive to
and
than to the flange width and friction coefficient. To reduce stress
concentration, a design with changes in
and
is considered. A 20% reduction in
and a 10% reduction in
is selected. The predicted percentage reduction in the von Mises stress is
6.76 (0.2832 × 0.2 + 0.1094 × 0.1).
The proposed design changes will affect the contact pressure at the
wiper-windshield interface, and the sensitivity results are used to quantify
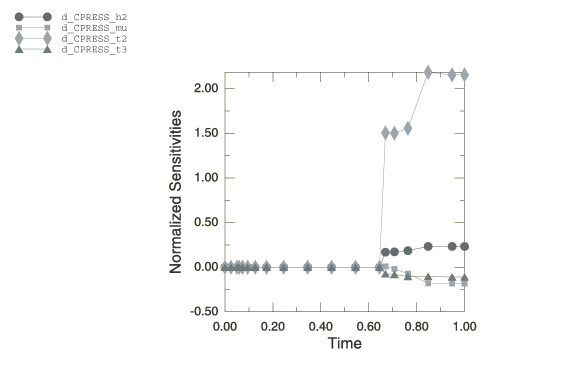
this effect. The time history of the normalized sensitivities of contact
pressure at a point at the tip is shown in
Figure 7.
Contact pressure at this point is most sensitive to .
This result is somewhat unexpected since this design parameter does not affect
the interface explicitly.
has a directly proportional effect, while
has an inversely proportional effect on the contact pressures. Thus, decreasing
will decrease the contact pressure while decreasing
will increase the contact pressure. The contact pressure histories for the
proposed design and the current design are shown in
Figure 8.
The plots indicate that the reduced stress concentration in the proposed design
comes at the cost of decreased wiper performance. (The proposed design has a
lower contact pressure, which could be suboptimal.) If desired, the contact
pressure can be positively influenced by considering a positive change in
.
All results discussed above are obtained in an incremental DSA
analysis using the unsymmetric solver. If the user is interested only in the results at
particular increments (typically, the last increment), total
DSA will be advantageous computationally. Similarly,
neglecting the unsymmetric terms will improve computational efficiency. To quantify the
error in such approximations, we compare the results for various combinations to the overall
finite difference method (OFD). Table 2
lists the relative error in the maximum Mises and contact pressure sensitivities compared to
the results obtained using the OFD method. For the dominant
shape parameter,
, the sensitivity results of the maximum von Mises stress are in good
agreement with the OFD method for all the combinations.
However, neglecting the unsymmetric terms in total DSA
gives inaccurate results for the contact pressure sensitivities. The relative error is large
for the less dominant shape parameters, with total DSA
giving poor results for both the Mises and contact pressure sensitivities. Total
DSA gives inaccurate results for sensitivities with
respect to the friction coefficient. Although the sensitivity results are problem dependent,
we can infer that total DSA may give poor results if we
neglect unsymmetric terms. Further sensitivities of interaction pressures are more sensitive
to approximations than the sensitivities of maximum stresses in the structures. Less
significant sensitivities are affected more by approximations than the dominant
sensitivities.
The proposed design changes are made and the analysis is rerun. A 9%
reduction in the stress concentration is observed. Predicted and actual contact
pressure histories are shown in
Figure 9.
The difference between the predicted and the actual results is due to the
nonlinear dependence of the design response on the design parameter. However,
the rerun confirms the prediction that the proposed design is more robust, with
a possibly suboptimal wiping pressure.


