Compare Page | ||||
|
| |||
The Compare page displays your analytics case, where each column
represents an alternative, and each row represents a parameter, as shown in the
following figure: 
 Requirements
 Alternatives
 Data
View
Data
View Action Bar
 Parameters
The Compare page is arranged as follows:
- The first column contains the parameters. (You can double-click a parameter name to edit it.)
- The second column contains the requirements, if any, for each parameter—the priority, the objective, upper and lower threshold values, and a target value.
- The remaining columns show each alternative.
- A symbol
 indicates if a parameter value lies outside the threshold
range.
indicates if a parameter value lies outside the threshold
range.
- Green highlighting indicates the parameter value that is the best match for the objective; for example, if you are trying to minimize a parameter, Performance Trade-off highlights the alternative with the lowest value.
- A symbol
Data Views
Performance Trade-off provides three views of the data in your analytics case:
- Actual
- Click
 to see the absolute value of the parameters. This is the
default view.
to see the absolute value of the parameters. This is the
default view.
- By Differences
- Click
 to see the relative difference between a parameter value
and the value of the baseline (leftmost by default) alternative in the table.
to see the relative difference between a parameter value
and the value of the baseline (leftmost by default) alternative in the table.
- By Percentage
- Click
 to see the percentage difference between a parameter value
and the value of the baseline (leftmost by default) alternative in the table.
to see the percentage difference between a parameter value
and the value of the baseline (leftmost by default) alternative in the table.
 from
the column heading to specify the baseline alternative. In most cases, you will
select the best alternative as the baseline and use the relative view to view
the difference or percent difference between the best alternative and the other
alternatives.
from
the column heading to specify the baseline alternative. In most cases, you will
select the best alternative as the baseline and use the relative view to view
the difference or percent difference between the best alternative and the other
alternatives. Icon View
Click
 on the
Compare page to see the files stored as
parameters in your analytics case. For example, the images attached to a
Results Analytics
analytics case that you opened.
on the
Compare page to see the files stored as
parameters in your analytics case. For example, the images attached to a
Results Analytics
analytics case that you opened.
Alternatives Operations
You can operate on the alternatives in the
Compare page as shown below:
|
|
Recommend |
|
|
Like |
|
|
Comment |
|
|
Menu |
|
|
Reorder columns |
 |
Thumbnail |
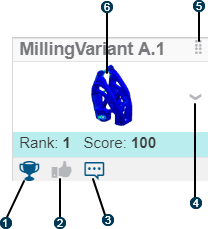
- Recommend, Like, or Comment
- You can recommend, like, or comment on an alternative by clicking the icons in the column heading. Performance Trade-off highlights the icon to indicate a recommended or liked alternative and to indicate that a comment is present.
- Menu
- The alternative menu allows you to:
- Hide an alternative. Use the Visibility Management command in the action bar to hide/unhide one or more alternatives.
- Map a parameter in an alternative to a parameter in another alternative.
- View the results associated with an alternative in 3DPlay.
- Open the results in Physics Results Explorer, if the alternative contains the results of a Physics Simulation.
- Reorder columns
- To change the order in which the alternatives (columns) appear in
the table, you can drag an alternative left or right. For example, you may want
to drag the highest ranked alternative to the leftmost column. You can also
click
 or
or
 to order the alternatives by ascending or descending rank.
- Thumbnail
- You can double-click the thumbnail to open it in 3DPlay. You can also drag the thumbnail to other applications.
- Visibility Management
- You can show or hide alternatives using the Visibility
Management
 command in the action bar. From the Visibility Management dialog box,
you can select alternatives to be shown or hidden. You can also search
or filter alternatives.
command in the action bar. From the Visibility Management dialog box,
you can select alternatives to be shown or hidden. You can also search
or filter alternatives.