About Previewing the Parameters in an Analytics Case | ||||||
|
| |||||
The Preview page displays a summary of the parameters stored in a data set. You can review the summary to determine that the data are correct before you begin analyzing it. You can also review basic statistics about each parameter, such as the range of values and the mean value. The Preview page provides an overview of the data set and allows you to understand the context in which you are making decisions and arriving at a recommended design.
Parameter Summary
The parameter summary table provides the following information about each parameter:
- Parameter Name: If you created the data set
by reading from a results file, the name of a parameter is the same as the
parameter created by
Process Composer.
If you created the data set by reading from a Microsoft Excel® or
.csv file, the name of a parameter is extracted
from the first row.
You can group parameters extracted from a spreadsheet using the following format groupname.parametername.
- Units: Results Analytics reads the units for the parameters from a Process Composer simulation job file (.nrf) or from an Isight results file (.zrf). Alternatively, if the field is blank, you can enter the units in the Parameter Summary table.
- Mode: The mode of a parameter refers to the
role of the parameter in a
Process Composer
or Isight workflow and can be
Input or
Output. A parameter that provides input into
the workflow has a mode of
Input, and a parameter that is generated by
the workflow has a mode of
Output. A parameter that is both input and
output in
Process Composer
or Isight (Input/Output) is labeled as
Input when it is imported into
Results Analytics.
Parameters that are imported from tabular data are labeled as
Unknown, and you can use the
Preview page to change the mode to input or
output, as desired.
Note: The mode field is used by the Predict page—predictions treat input parameters as independent variables and treat output parameters as dependent variables.
- Alias: Results Analytics displays the alias name as you work through the app to select recommended alternatives. By default, the alias is the same as the parameter name; however, if you would prefer to see a different name for the parameter in Results Analytics, you can click the alias string and enter the new name.
- Min/Max: The minimum and maximum value of the parameter in the data set. These values are calculated by Results Analytics.
- Notes: An optional description of the parameter.
Parameter Statistics
The parameter statistics provide a
Quantile Histogram showing the distribution of a
parameter along with the range and the number of samples in the data set. You
can hover over a bar in the histogram to see the range and the number of
samples of the data grouped into that bar.
The
Quantiles values list some basic statistics for
each parameter in the data set, such as its maximum and minimum values, median,
and upper and lower quartiles. The
Moments values list the mean value of the
parameter in the data set along with its standard deviation, variance,
skewness, and kurtosis—measures of the distribution of the data. For example,
the following figure shows the distribution of peak engine speed for the 32
data points in the car comparison data set:

Note the following:
- The maximum peak engine speed is 7000 rpm; the minimum peak engine speed is 4500 rpm.
- The mean peak engine speed of the 32 data points is 6070 rpm with a standard deviation of 546.
- The upper quartile (6500 rpm) is halfway between the maximum value and the median and contains 25% of the data points.
- The lower quartile (5750 rpm) is halfway between the minimum value and the median and contains 25% of the data points.
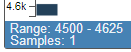
- You can hover over a bar in the histogram to see more information.
For example, there is one sample (data point) in the lowest bar, and it lies in
the range between 4500 and 4625 rpm:
If your analytics case was generated by the Monte Carlo adapter in Process Composer, the Preview page indicates the distribution type that was used with an input parameter, along with the mean and variance of the generating distribution.
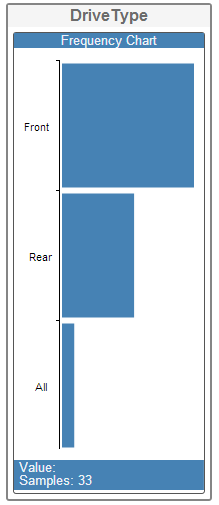
If a parameter is a string, the parameter statistics show information
about the frequency with which the string appears in the data set, as shown in
the following figure:
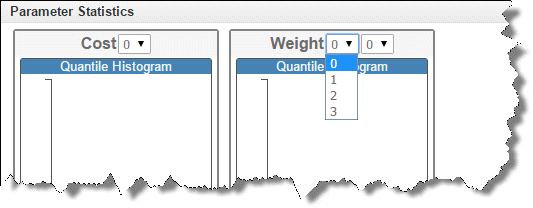
If a parameter is an array, the parameter statistics show information
for only a one-dimensional slice of the array. By default,
Results Analytics
calculates the statistics using the first element of the array for each data
point; however, you can select a different element using the menus adjacent to
the parameter name. If the array is composed of multiple dimensions,
Results Analytics
provides menus that allow you to select the desired elements of the array, as
shown in the following figure: