Data Points Filters | ||
| ||
Results Analytics provides several tools for filtering out data points that will not be considered for a recommended alternative. Filtering out unwanted data points helps to give you a clearer picture of your data set and a better understanding of the remaining alternatives.
Filtering based on upper and lower parameter values
You can drag the limit arrows in the parameter histogram to specify the upper or lower filter values, or you can click ![]() and enter the values. Data points that fall outside the filters are hidden from the data table and from scatter plots; however, they are still scored and ranked, and their feasibility is still assessed.
and enter the values. Data points that fall outside the filters are hidden from the data table and from scatter plots; however, they are still scored and ranked, and their feasibility is still assessed.
For example, the following parameter histogram plot shows how the user used the Define page to set a lower threshold of 20 and an upper threshold of 38, to eliminate car designs with a cargo capacity below 20 and above 38. In addition, the user set the lower filter value to 27 to hide car designs with a cargo capacity below 27. Data points that are filtered out by the thresholds or hidden by the upper or lower filter values appear as empty bars in the parameter histogram plots.
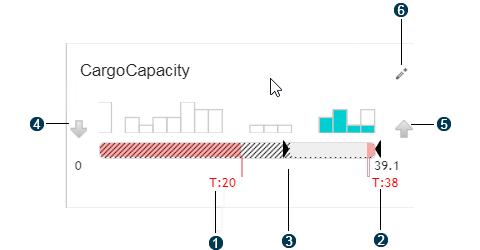
 Lower threshold
 Upper threshold
 Lower filter value
 Set objective to minimize
 Set objective to maximize
 Edit threshold values
Filtering based on scores
You can use the overall score views to filter values based on their score. Alternatives that are filtered out are removed from the data table; however, they are still scored and ranked, and their feasibility is still assessed. Results Analytics provides two views of the overall score, and each view applies a different filtering technique. Any existing filters are lost when you change views.- Categorical view
- The categorical view allows you to filter out groups of scores by clicking on a region of the diagram. For example, the following figure shows how you can filter out the bottom 75% of the data points:
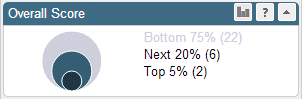
The number in parentheses after the filter name indicates the number of data points in that category. For example, 22 data points are contained in the filtered bottom 75% of the data points in this example.
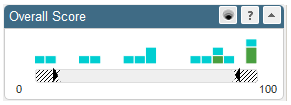
- Histogram view
- The histogram view provides sliders that allow you to filter out data points below a selected lower score or above a selected upper score. For example, the following figure shows how you can filter out scores below 10 and scores above 90 from the data points:
Filtering based on feasibility
Results Analytics assesses the feasibility of each data point based on the requirements that you specify—thresholds, objectives, and priorities. For more information, see Data Points Feasibility. You can use the feasibility filters to filter values based on their feasibility.Excluded points are data points that have been explicitly excluded from grading by the user. To exclude a data point, you right click on a cell in the data table and select Exclude design from the menu that appears. Unlike filtered data points, Results Analytics removes excluded data points from the scoring and ranking (they are given a score of zero). Excluding also excludes a data point from approximations.
Excluded data points are filtered from the data table by default. To view your excluded data points (and potentially re-include them in the scoring and ranking) toggle on Excluded from the Feasibility legend to the left of the data view. Excluded data points appear grayed out at the bottom of the data table. To restore an excluded data point, right click on a grayed out cell in the data table and select Include design.
The following figure shows that the three excluded data points in the data set have been removed from consideration—they are filtered out of the scoring and ranking and do not appear in the three data views (table, scatter, and map views). However, the three infeasible points are still under consideration—they are scored and ranked and appear in the data views.

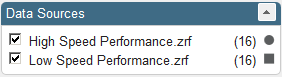
Filtering based on data source
If your analytics case was created from multiple data sources, such as multiple Isight files (.zrf files), you can select which sources to include in your data set. Data points from data sources that are filtered out are removed from the data table; however, they are still scored and ranked, and their feasibility is still assessed.