About Approximation Measures | |||||||
|
| ||||||
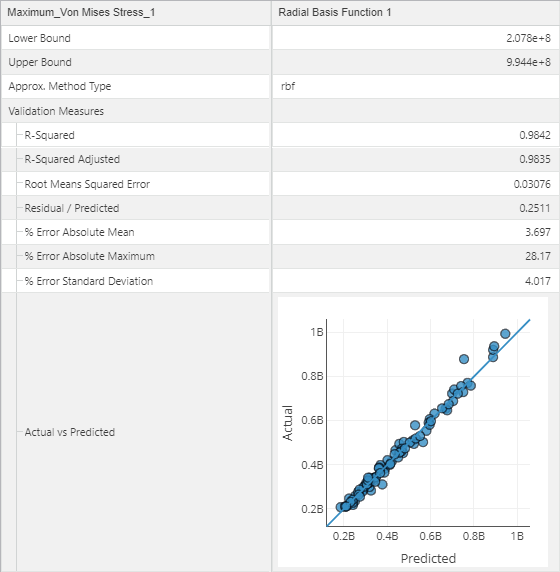
For each output parameter, Results Analytics performs a regression analysis to measure how well the predicted model approximates the actual function at the data points used to construct the model.
The approximation measure also displays tables of error measures. The tables provide a quantitative measure of the accuracy or fit of the approximation.
You can add a scatter plot of actual parameter data versus predicted parameter data based on the selected approximation appears in the visualization.
You can add a residual plot that shows residuals for each output parameter value on the Y-axis and predicted values for the output parameter, based on the selected approximation, on the X-axis.
You can add a histogram that shows the error for each degree of the approximation polynomial appears in the visualization.
The following visualization features an Actual vs Predicted
plot: