Visual Analytics Page | |||||
|
| ||||
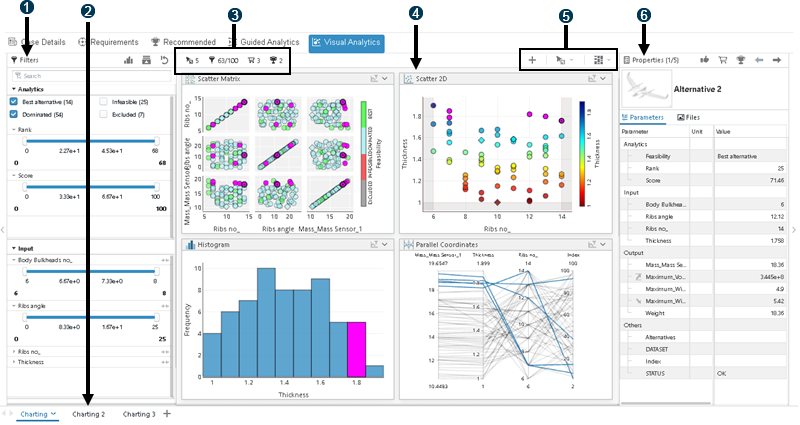
The Visual Analytics page provides a canvas for data visualizations of your results. These visualizations include charts, graphs, and tables.

 Filters Panel
 Tabs
Tabs
 Alternatives Information Area
 Canvas
 Visualization Controls
 Properties Panel
Filters Panel
Results Analytics provides several tools for filtering out data points that will not be considered for a recommended alternative. Filtering out unwanted data points helps to give you a clearer picture of your data set and a better understanding of the remaining alternatives. You can show or hide the Filters panel to provide more room for the canvas.
Tabs
Tabs allow you to organize your visualizations in different sheets and navigate between these
sheets. Double-click to rename a tab; click ![]() and then
Delete
and then
Delete
![]() to delete the tab
and all visualizations within it.
to delete the tab
and all visualizations within it.
Alternatives Information Area
This area displays the number of alternatives selected and shown in the Properties panel, the number of alternatives shown in the visualizations on the canvas, the number of alternatives in the basket, and the number of recommended alternatives.
Canvas
The canvas is where the visualizations appear. You can resize and drag each visualization to move it on the canvas.
Visualization Controls
You can use the visualization controls to create a new visualization, manage the selected alternatives, and alter the view of visualizations on the canvas. You can arrange visualizations in one, two, or three columns to best fit your window size.
Properties Panel
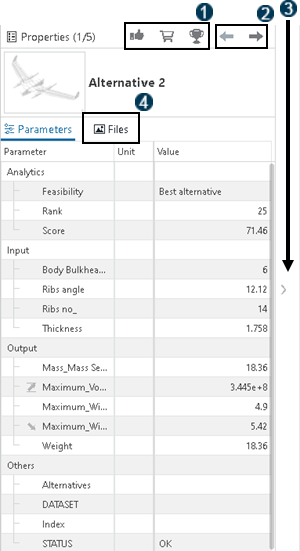
You can view the parameters and files for each alternative from the Properties panel. The Properties panel shows parameter values and images for the current selected design.

![]() You can Like
You can Like
![]() , Add
to basket
, Add
to basket
![]() , or
Recommend
, or
Recommend
![]() an alternative. For
more information, see Annotate, Like, and Recommend a Data Point.
an alternative. For
more information, see Annotate, Like, and Recommend a Data Point.
![]() You can navigate between selected designs from the arrows at the top of the
Properties panel.
You can navigate between selected designs from the arrows at the top of the
Properties panel.
![]() You can show or hide the
Properties panel to provide more room for the canvas.
You can show or hide the
Properties panel to provide more room for the canvas.
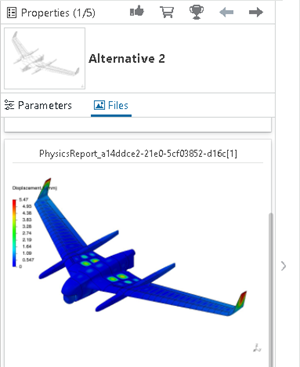
![]() You can access contour plots from the Files section of the properties
panel, as shown below.
You can access contour plots from the Files section of the properties
panel, as shown below.