-
From the home page, click Projects, Studies, and Experiments.
-
Open a completed experiment, and then open the Convergence
tab.
-
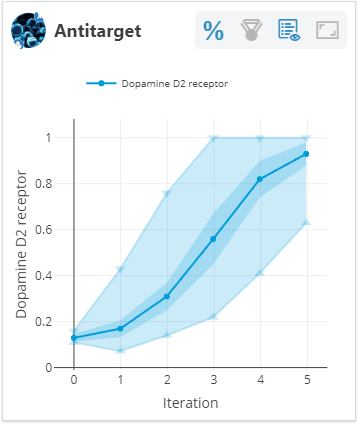
Review the convergence charts.
The charts display the average predicted value over all iterations of each property
you are optimizing in your experiment. Ideally, values trend towards higher desirability
scores and then level off to indicate that the optimization has converged.

You can control the display of the charts with the following tools:
- Click to switch between raw and desirability values
for all charts.
- Click to switch between all values and the top ten
for all charts.
- Click to show or hide the legend for the
chart.
- Click to maximize or minimize the chart.
-
Run another experiment:
- If additional iterations are required, create a new experiment using the molecules
generated and parameters used in the last iteration. For more information, see Creating and Running Experiments.
- If you do not see convergence, try creating a new experiment with adjusted
weights, desirability profile settings, maximum iterations, or other
parameters.
|