Chart Types
| Line Chart |
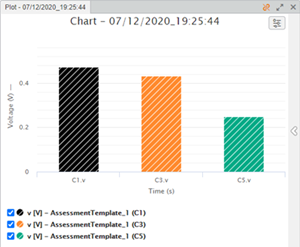
Bar Chart |
In this type of chart, the simulated variables are displayed as series with
continuous
curves.
|
In this type of chart, only the discrete values of the variables are
displayed.
You
can display multiple series of data for comparison. The heights of the bars
represent the values of the series and they are animated in sync with the
simulation.
|
Chart Axes
The axes of the chart are displayed differently depending on the units of the variables
that are being plotted.
| Units |
Variables |
Axes |
| Same |
One or more |
Displays one variable axis with units on the left side
|
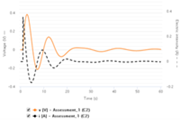
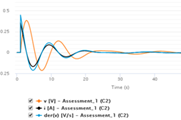
| Different |
Two |
Displays one principal axis on the left side for the solid curve and one
secondary axis on the right for the dashed curve
|
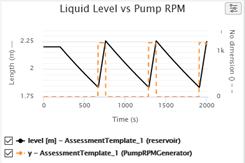
| More than two |
Displays one axis with no units
|
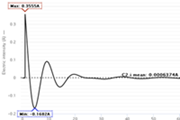
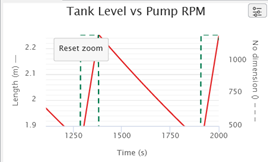
Zoom
You can zoom into any part of the chart by drawing a rectangular selection. A
Reset Zoom option appears in the chart area. You can click this
option to restore the original zoom of the chart.
| Before Zoom |
After Zoom |
 |
 |


