You can create a plot using the Plot Window
 command from the Design section of the action bar.
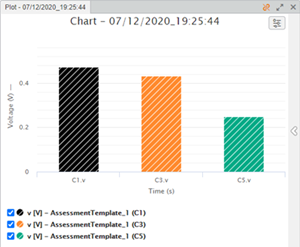
- Charts
- Charts are used for plotting the simulated variables and shown on the left side of the
plot window. During the replay of the simulation using the animation player, an animated
marker
displays the instantaneous values of the variables on their respective series.
-
- For more information about the charts, see About Charts.
- Properties
- You can customize the display of charts by configuring their properties. The properties
are displayed in a separate collapsible area on the right side of the plot window.
Depending on the selected object in the chart, the properties of the object are displayed
accordingly.
- For more information about the properties, see About Plot Properties.