System Tile Description
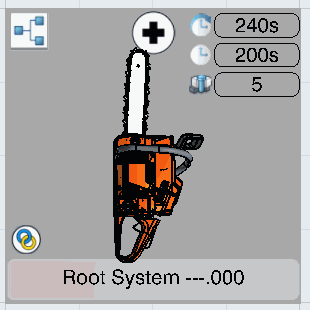
System Editor visualizes systems by means of tiles. Information about the system is displayed on the tile using icons and numerical values. If parts are assigned to a system, the tile has a 3D representation of the parts on top of it.
The following image shows the top view of a typical system tile. 
The icon in the upper-left corner represents the system type (for example, General System). The name of the system is displayed at the bottom of the tile.
If a scope is defined between the system and an item, an icon ![]() appears in the lower left corner.
appears in the lower left corner.
If a scope is defined between the system and a resource, an icon ![]() appears in the lower left corner.
appears in the lower left corner.
Numerical Values
The following information is displayed in the upper-right corner of the tile:
- Current Cycle Time, which is the cycle time of the root system
- Total Time of Operations, which is the sum of the durations of all the operations under the system. The time type on the operations is considered as Estimated time.
- Number of Assigned Fasteners, which is the number of fasteners assigned to the system (or to child systems of the system).
You can choose to show or hide this information using the Information on tile options in .
Visual Feedback on Tiles with No 3D Representation
If there is no 3D representation of the assigned parts on a system tile, item icons are displayed on the system tile.
If the system has a scope with an item, an icon representing the item with a
scope link to the system is displayed in transparent mode. An item is identified
by means of a tooltip. ![]()
All items linked to operations within the system are taken into account. When
there are several possible items, only the last items are shown. For example, if
there is a data requirement between P1 to P2 and both items are implemented,
then only P2 is shown. The icons have an opaque visualization. ![]()
A maximum of nine icons can be shown. If there are more icons than that, then a
symbolic icon "groups" the remaining items, which are identified by means of a
tooltip. ![]()
Links Between Systems or Workplans Tiles
It is possible to visualize data requirements existing between items scoped by these systems or these workplans.
The start of the link is always a system or a workplan having a scope with an item.
The end of the link is all the operations implementing this item. If there are no operations implementing the item, then the system or the workplan with a scope to the first scoped successor item is the target.
This link is transparent and not selectable. Data requirement links are shown when the Display Constraints for Implemented Objects option is defined in the App Options panel. The link is visualized only if there is no product flow between the concerned operations. For more information, see System Editor Display.


