Using the Pie-Chart Report View of the Extract Report | |||||
|
| ||||
-
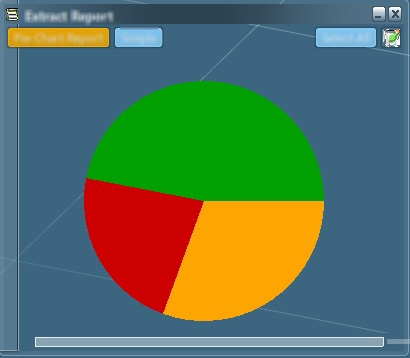
In the Extract Report panel, select Pie-Chart Report.
The pie chart view of the report appears.
 Note: When running an extract for the first time, the pie chart view is displayed by default.
According to the extract status, three colored sections can be displayed in the pie chart:
Color Corresponding Extract Status 
Done This status means that objects are extracted.

Error This status means that objects are not extracted.

Warning This status means that objects are extracted but discrepancies can be found between the design content and the extracted content (For example, non-versioned branches are likely to have different lengths).
Note: To be readable, the smallest pie chart section has by default a 10 deg angle. The other section angles accommodate consequently.