Creating Plots

You can use an XY plot to visualize and analyze live plot results in the Functional & Logical Design app. An XY plot is a two-dimensional graph of one variable or several variables versus another variable, for example, time.

This task shows you how to:


Before you begin: Display a Signal Monitor window. See Functional & Logical Design User's Guide: Performing a Virtual Execution: Working with the Signal Monitor.

Plot One or Several Variables

You can plot one or several variables.

To plot variables (scalar variables only), do any of the following:
  • To plot one variable in a new plot, from the Signal Monitor window, right-click the variable and select Add to Plot > New Plot .
    Tip: You can also double-click the variable.
  • To plot several variables in a new plot, from the Signal Monitor window, multiselect them using Ctrl when clicking, then right-click them and select Add to Plot > New Plot .

If plots are already present, you have those plots as alternatives to New Plot when using the contextual command.

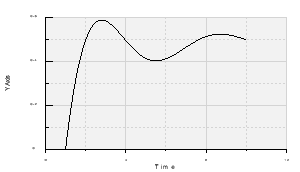
The variable or variables are displayed in a new plot. An example of one variable:

Tips:
  • You can display the origin of the signal, that is, the title of the corresponding simulation. See About XY Plot.
  • You can rename a plot. See Renaming Plots.
  • You can change the display unit for a curve. See Modifying Curve Options.
  • You can modify the variable used as the abscissa of the plot, see Changing the Abscissa.
  • You can negate a curve. See Negating Curves.
  • To find the signals to plot for an animated 3D shape, you can center the Signal Monitor on the corresponding node by selecting the shape, and then, from the context toolbar, click Show in Variable Browser .

Plot All Simulations for One or Several Variables

You can plot all simulations for one or several variables. Imported simulation results are also included.

To plot all simulation for variables (scalar variables only), do any of the following:
  • To plot, in a new plot, all simulations for one variable, from the Signal Monitor window, right-click the variable and select Add All Simulations to Plot > New Plot .
    Tip: You can also double-click the variable.
  • To plot, in a new plot, all simulations for several variables, from the Signal Monitor window, multiselect them using Ctrl when clicking, then right-click them and select Add All Simulations to Plot > New Plot .

If plots are already present, you have those plots as alternatives to New Plot when using the contextual command.

All simulations of one or several variables are displayed in a new plot.
Tips:
  • You can display the origin of the signal, that is, the title of the corresponding simulation. See About XY Plot.
  • You can rename a plot. See Renaming Plots.
  • You can change the display unit for a curve. See Modifying Curve Options.
  • You can modify the variable used as the abscissa of the plot, see Changing the Abscissa.
  • You can negate a curve. See Negating Curves.
  • To find the signals to plot for an animated 3D shape, you can center the Signal Monitor on the corresponding node by selecting the shape, and then, from the context toolbar, click Show in Variable Browser .

Plot Variables in Watchlists

You can plot all the scalar variables in a watchlist.

To plot all the scalar variables in a watchlist, right-click the header of that watchlist and select Send to a new plot .
A new immersive plot window is created displaying the variables in the watchlist.
Tips:

Update Plot Results

The Plot window can be automatically updated after a parameter modification and simulation replay.

Before you begin:

The preference Update plotters after virtual execution must be selected. You can access this preference from Me > Preferences > App Preferences > 3D Modeling > Systems Modeling and Execution > Dymola Behavior Modeling , the Results tab, the Plots group.

  1. Perform a virtual execution.
  2. Plot the execution results.
  3. Modify a parameter in the Signal Monitor.
  4. Perform the virtual execution again.

The results are updated within the existing Plot window.