Working in Clustering Mode

You can display point groups as clusters to analyze their geographical repartition more easily.


Before you begin:

Clustering mode is available only for the following datasets:

  • Points of Interest and Simple Feature prepared datasets with points
  • Datasets in preview containing points.

See Also
About Datasets
POI Representation Attributes
Simple Feature Representation Attributes
  1. From the standard section of the action bar, click Properties .
  2. Select a point dataset in the tree then in the representation attributes of the Properties panel, select Clustering.
    Clustering mode is activated and point groups are displayed as clusters. Clusters always have a spherical representation, whatever the representation selected in the Type list.

    The sphere diameter is automatically adjusted, the minimum size being greater than the size of an individual point.
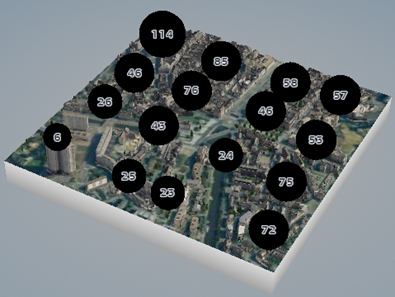


    Warning: For datasets containing different types of geometries (KML, GeoJSON), the number of points displayed on a cluster might not be correct.

    When you zoom in, less points are aggregated into more groups.
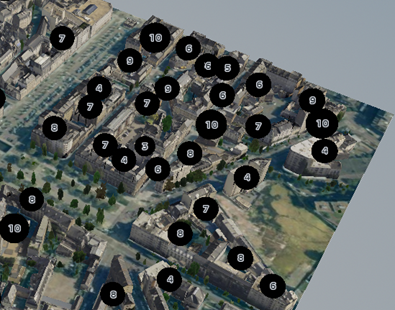


    When you zoom in enough, the display automatically switches to individual points. If required, you can change the display type for points in the Representation attributes area.
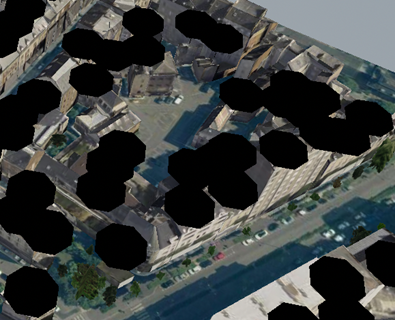
    Important: Clustering mode also takes into account the levels defined when the dataset is created. It means that clusters may not be split if you zoom in more deeply than the specified end level; inversely, clusters may not be visible if you zoom out under the specified start level.
  3. Optional: Select the dataset in the 3D or in the tree, and change its color.
    For datasets created from datasources with SLD with color information, clusters use the default dataset color and in that case, the cluster color is modified accordingly. Otherwise, the clusters use the default color which is "black". Datasets in preview are also assigned the default black color.
  4. Click Properties to close the panel.